


Trading Relative Strength - Energy and Bitcoin
ET has been outperforming it's energy peers. MARA is ready to break out.

Relative strength can lead you to the promise land, all you need to know is how to compare two ticker symbols.
Recently I discussed how I utilize watchlists to first start with a sector review and then drill down to the individual stocks within the sector.
This is another post with another simple tip to improve your trading. This time we are going to look at how to identify the strongest of the strong.
Complete with charts!
If a sector is breaking out and you identify the leaders within the space, you set yourself up with greater odds for a win. And improving your odds is the name of the game.
In addition to reviewing charts for break outs, you can also identify sector strength. The trick is to compare a sector ETF to an index ETF like SPY. It is another simple yet effective method for finding great set ups.
Taking it a step further, you can find stocks that are showing relative strength to their peers by comparing them to their respective sector ETF. This highlights the leaders within a sector, which is what you want to be trading.
Other times, you can do a straight comparison of stock to index ETF. Take a look at this price comparison for MARA vs SPY.
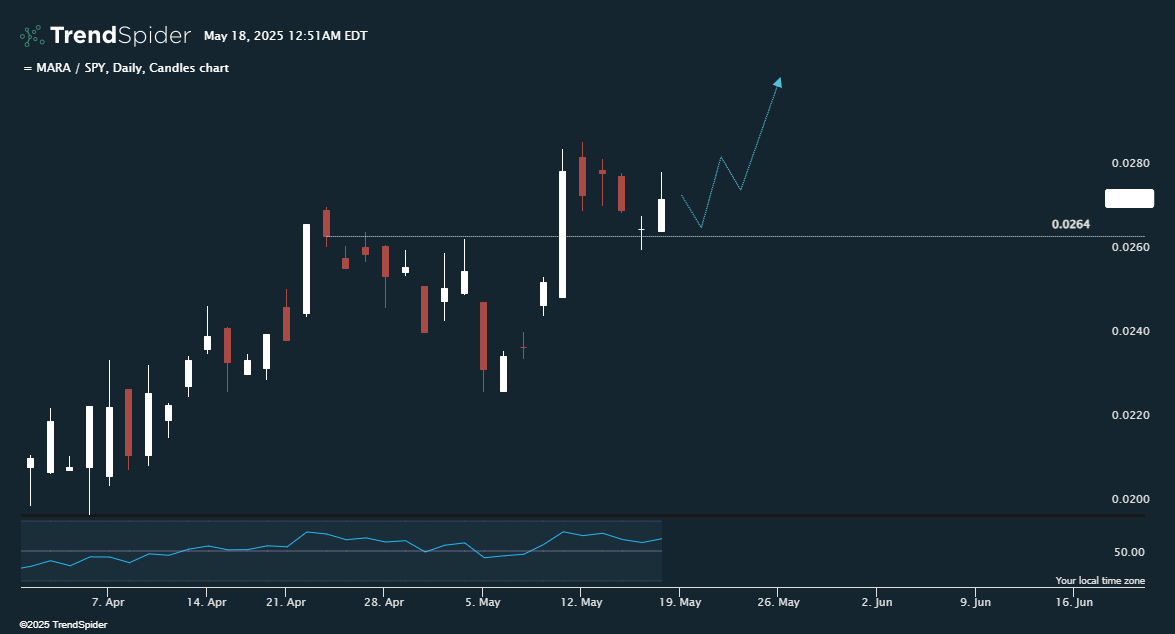
Bitcoin has been on a rip and the bitcoin miners have finally started showing signs of life. The relative strength of MARA to SPY has been increasing for over a month. I think this trend continues which is why MARA is one of the trade ideas this week.
There are other options. You could try to figure out whether a laggard is going to catch up or if a bottom or top has been put in. Count me out though. I stopped trying to do that a long time ago.
Trading the outperformers is a seemingly obvious yet often overlooked strategy. If you are able to do so within a hot sector, the set-up is that much better. Just think about this math.
Hot Sector + Sector Leader + Trend + Momentum + Chart Signals = Top Trade Ideas
If you can trade with 4 out of 5 in the above equation, you are setting yourself up for success.
Nothing is guaranteed, but each of these simple tips move the odds further and further in your favor.
The energy sector has caught my eye and within the sector the midstream/transportation/pipeline stocks have really performed well.
Top of my list is ET and this comparison against XLE (energy sector ETF) weekly candles shows how it is outperforming the energy sector overall.
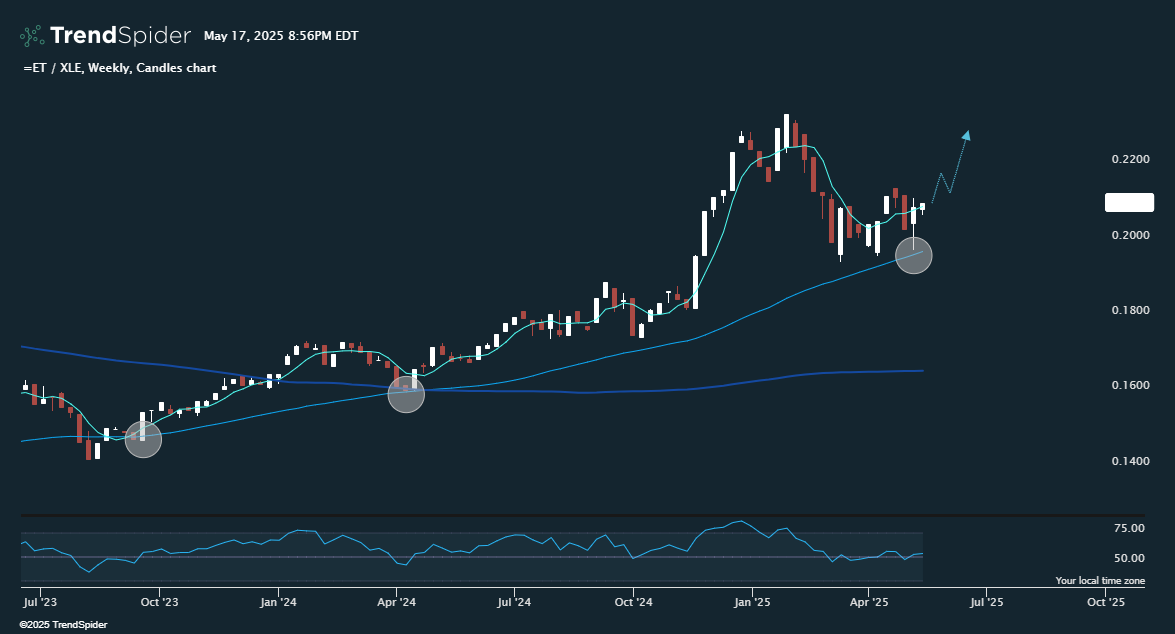
This weekly chart shows a continous uptrend, and it just tested the 50-week simple moving average (SMA). The bounce that followed sets up more upside.
A better comparison would be to its pipeline peers, which is represented by AMLP.

The stock has outperformed its sector ETF consistently. It has tested prior resistance which proved to be support and now the candles are again moving higher.
You can take it another step by comparing ET to a peer like Plains All American Pipeline, ticker PAA. Here is the chart of ET / PAA showing the performance since March.
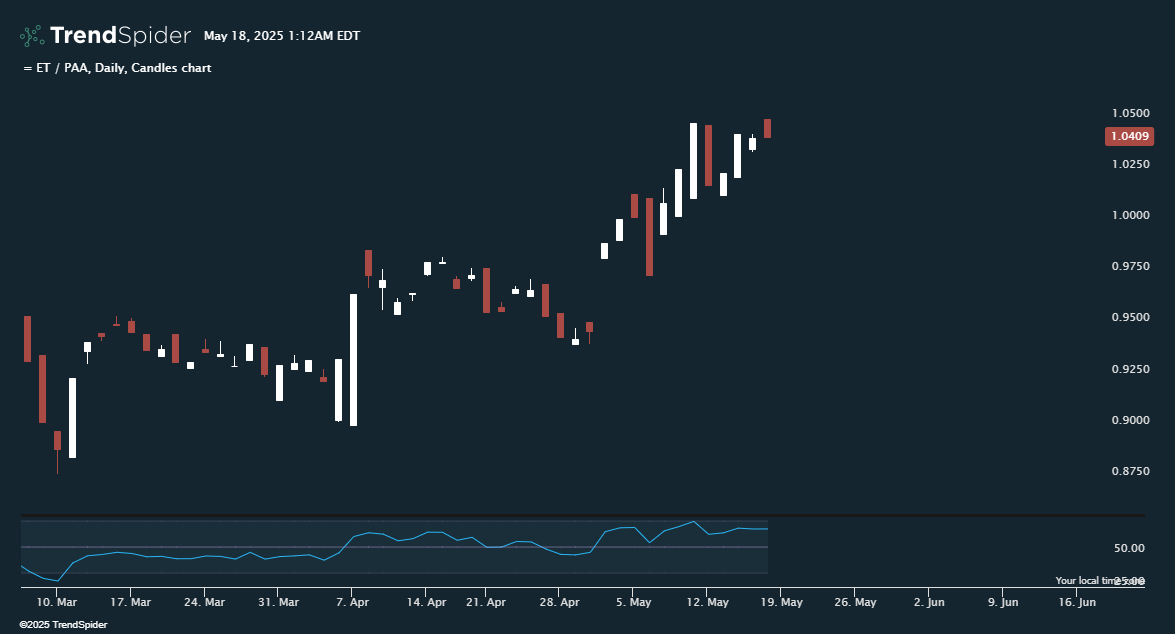
Hopefully it is clear why ET is one of the tickers I am looking to trade this week for a move higher.
Each of these charts look the same, up and to the right. This represents the strength of ET (the first ticker in each chart) to each ticker being compared to.
In TrendSpider, you can create these composite charts by entering ‘=’ followed by the ticker you are interested in, then a ‘/’, and then the ticker you are comparing to.
For example: = ET / PAA
If you’d like to sign up for TrendSpider but have not yet gone all in, I will say it is the absolute best service and worth every penny. Check it out.
Here is my affiliate link if you’re interested: TrendSpider
Hopefully sharing all of my watchlists, my 5-day SMA technique, and now this simple price comparison tip proves to be helpful towards improving your trading.
When you are ready, consider joining the growing number of traders that have access to the chat room, weekly trade ideas, and daily trade alerts.
We have a great time trading these tickers and a few more.
Now to the trading plans for the week.
Keep reading with a 7-day free trial
Subscribe to A Trader's Education to keep reading this post and get 7 days of free access to the full post archives.