


Trading Levels for SPY, QQQ, & SMH
Trading Levels for SPY, QQQ, & SMH
How much further can we climb? Higher highs and higher lows continue.
Despite closing lower on Friday, both SPY and QQQ had solid weeks of gains and markets keep rewarding the upside trade.
And SMH showed there is still demand for NVDA and semiconductor stocks as it bounced back right off of the support highlighted last week on The Trading Triangle.
The charts will let us know when it is time to sell and it will be a rough week of adjusting when that time comes.
Until then, all we can do is sort out a few scenarios to keep an eye on.
The chart below is of the daily candles for SPY. I’ve added the 3-point Fibonacci levels using the low point after the 2022 selloff, to the peak in the summer of 2023, back down to the October 2023 low.
The levels are worth paying attention to.
SPY

And yes, I have two bearish scenarios outlined and only one bullish arrow forecasted but that says nothing about my bias. It merely shows the options I see in front of us.
I would not be surprised to see a small pull back below 518.47 only to see it quickly recover, followed by another new higher high.
That said, RSI is making lower highs and has been since the start of 2024.
This is not a great sign for continued, unrelenting bullish moves. At some point, RSI curls downward and stays lower.
If we get a modest pull back, I would look to fill the gap that formed in February as a first potential pivot point. The reversal could happen near 497.50.
After gaps fill there is often a bounce that immediately follows and that would be the buy point to go long again.
However, this move would also likely drop shares below the 50-day simple moving average (SMA) which could create more cause for concern.
If shares continue to decline after filling the gap and cutting below the 50-day SMA, I would expect selling to accelerate a bit.
SPY could find support at 488.27 but there is a large volume shelf between 471 and 472 that I think is more likely to be the support level that it gets to.
That would be about a 9.5% drop from Friday’s close.
While it would not be very enjoyable, it would also not be catastrophic and would present potential buying opportunities.
QQQ
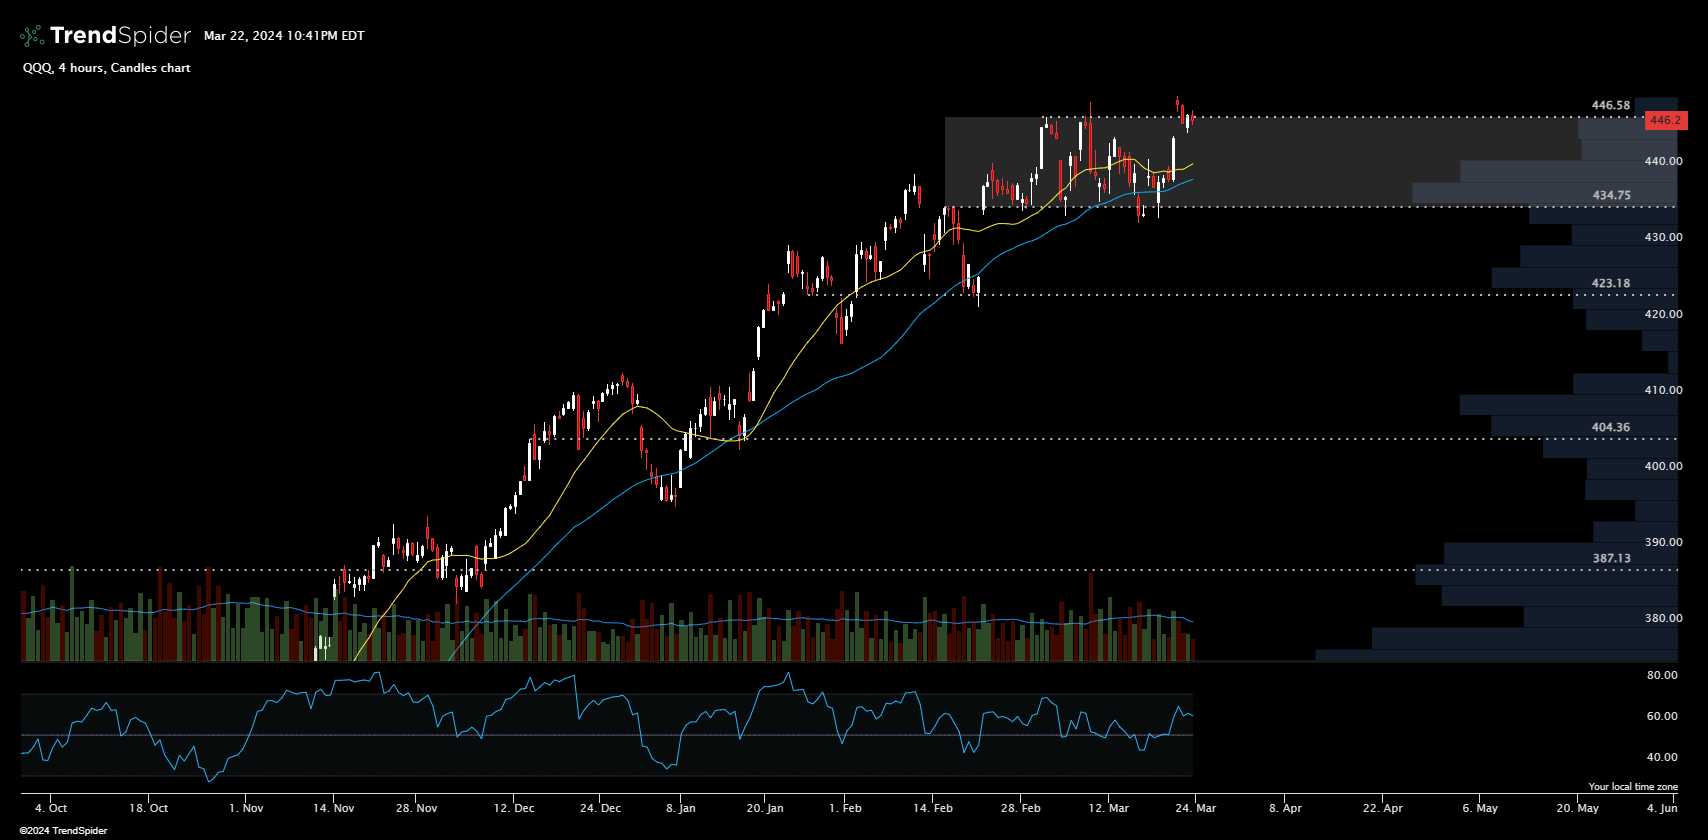
If QQQ can’t get above 446.58 and hold, we could see some range trading which could makes some sense based on the top holdings for this ETF.
All of the big tech favorites round out the top 10 and nearly 50% of the fund.
MSFT, AAPL, NVDA, AMZN, META, AVGO, GOOGL, COST, GOOG, and TSLA.
These are all names that have been on an incredible run and could use some consolidation.
Not necessarily a sell off, but perhaps some sideways action for a short while is what we will see.
The range to watch is 434.75 to 446.58, with the potential for the bottom of the range to expand to 423.18. I would not want to see that level break because the next potential support is not until 404.36.
That said, if semiconductors continue to power higher they will pull the entire market along and SMH is showing signs of trying to get back to the recent all-time high.
SMH
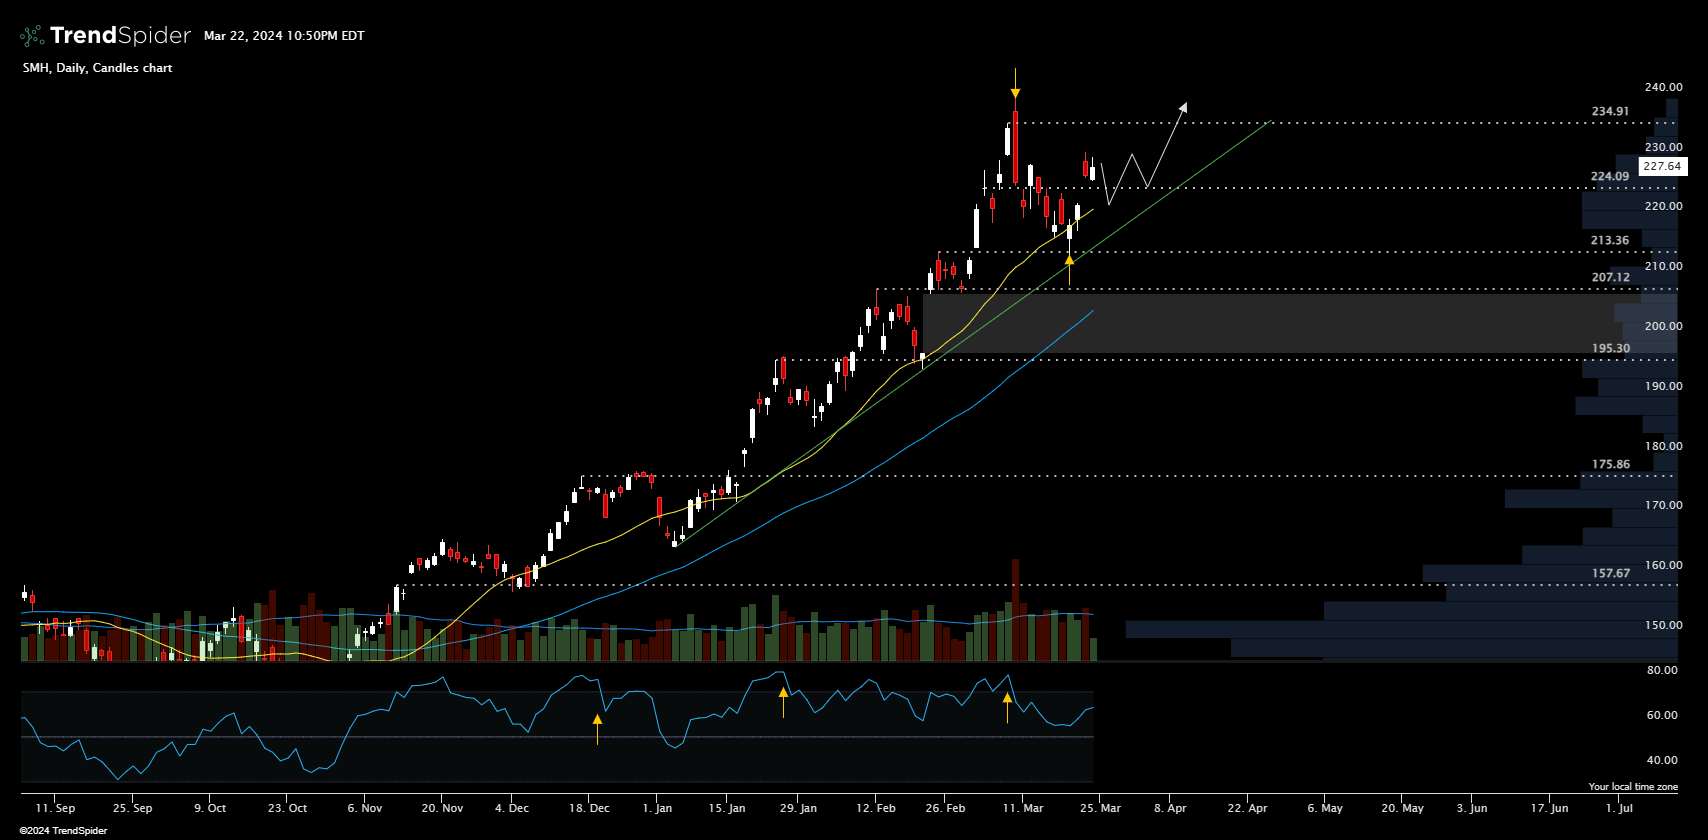
I am looking for 224.09 to hold up but we could first see the small gap filled before a recovery back above this support level.
The move back to 235 could be met with resistance, forming a double top. Keep this in mind and be sure to take profits at this level even if you are trading for additional upside.
The key to longevity in trading is to take initial profits at noted resistance levels. This ensures you’re locking in gains and if you see more upside you are still in the trade.
Let’s see if NVDA can continue to lead the entire sector and really the entire market higher.
I have noted that industrials, financials, and really nearly everything is working well and moving higher. However, there is a lot of momentum that came with NVDA announcing such a bullish outlook for its own future.
The future is definitely going to be run on semiconductors and the extent to which companies can increase profits through technology and automation will largely be dependent on how well the industry can perform.
It sounds obvious, but the thought that NVDA could be the single stock that decides market direction is a little worrisome. It could become a single point of failure for the stock market.
I am still bullish overall because the charts have not yet given a clear signal to pivot and become bearish. If anything, the charts have given nothing but bullish signals.
The diverging RSI is the one indicator that is causing concern, is worth noting, but is not enough on its own to start selling.
More trade ideas dropping tomorrow, stay tuned for those. And if you haven’t tried out the upgraded subscription yet you might want to check it out with a free 7-day trial.
There is no risk to you and if you enjoy the additional insight into the trade ideas I am considering, the options contracts I am looking at, and every other detail that goes into my weekly trades, you can stay subscribed for only $8 per month.
I appreciate all of you, whether you upgrade or not. I hope you are enjoying A Trader’s Education and are also learning a little along the way.
Enjoy your weekend!
-Nate
When you are ready for TrendSpider, please use the link below to sign up!
Anchored VWAP is just one of the many top notch features TS provides.
Check out TrendSpider and let me know if you have any questions.

This service is for general informational and educational purposes only and is not intended to constitute legal, tax, accounting or investment advice. These are my opinions and observations only. I am not a financial advisor.