


The Stock I'm Buying Next Week and Why
Plus, more on the Covered Call Strategy portfolio and a look at a few charts.


This service is for general informational and educational purposes only and is not intended to constitute legal, tax, accounting or investment advice. These are my opinions and observations only. I am not a financial advisor.
The stock market is in a tug-of-war and the news cycle is creating a lot of volatility. This creates opportunities for those willing to put their money to work.
You know that is what I am doing.
While the Covered Call Strategy (CCS) Portfolio crushed it with over 18% realized gains in February, far outpacing the stock market, March has cooled things off a bit.
How do I get these results? I utilize the Covered Call Strategy on growth stocks. Most implement the strategy with blue chip companies, but I prefer to focus on bigger gains.
A quick look at how things are going.
The shares of MARA performed well but only after a very volatile stretch which caused me to drop the strike price of the calls sold against the shares of MARA I own.
When the share price took off this week, the portfolio had sold covered calls to protect against potential downside and therefore was limited in the upside that was captured. This happens on occasion but is part of the process.
When the news cycles create big volatility spikes, the prices of growth stocks can have larger than average swings in both directions. This increases the difficulty of trading but also opens up the door to make more money.
Another stock that did not move like I would have liked is SOFI. It remained flat after dropping significantly on the bank news. I sold out of the shares after collecting some cash from selling a call first.
The portfolio still maintains a position in DKNG and I’m expecting the shares to continue to bounce around under $20 but also with support coming in between $17 and $18. I’m selling more calls just outside of this range for now.
NIO has allowed me to sell seven calls against it over the past month, which is a ridiculous number and allowed me to collect a lot of cash. That cash has offset the losses since reporting earnings.
NIO needs to hold $8 or I will cut my losses. That said, I think it is heading back to $9.40 which is where I plan to take an exit with profits in hand.
So what am I doing with the cash collected from sales?
Semiconductors Leading the Stock Market
If you have tuned into the weekly chart review on Twitter Spaces (Sundays) you have heard me talk about what sectors or areas of the market I think will lead into the next move higher. The next bull run.
Semiconductors, or microchips, or simply chips are where I think we will find leadership. And for the CCS Portfolio, there is a chip stock that fits in nicely.
But first, let’s take a look at the sector.
The vehicle I like to use for tracking the performance of microchip companies is the Vaneck ETF Trust Semiconductor ETF, ticker SMH.
The chart for SMH looks promising. Specifically, it appears to show a reverse Head and Shoulders pattern.
A Head and Shoulders pattern forms when you have three peaks, the middle being higher than the other two. When the “neckline” of these three peaks is broken, historically we have seen follow through continuing straight through the neckline.
A reverse of this pattern is just flipping it upside down. And when the neckline is broken, the shares typically continue to move higher with good momentum.
SMH Chart

The undisputed leader of the sector has and continues to be NVDA. You can see the same reverse H&S pattern plus the break out that followed after crossing above the neckline.
The 20-day simple moving average (SMA, yellow line) is now providing support and you can expect the shares to continue higher as long as they stay above this average.
NVDA Chart

Another chip company that you are familiar with, AMD, has been showing positive signs. Starting with a break of the recent downtrend and solidified with the higher highs and higher lows forming.
Also note the 20-day SMA crossed above the 50-day SMA (circled) which is a short term, bullish signal. Even better, the 50-day SMA crossed above the 150-day SMA. This is intermediate term bullish.
AMD Chart

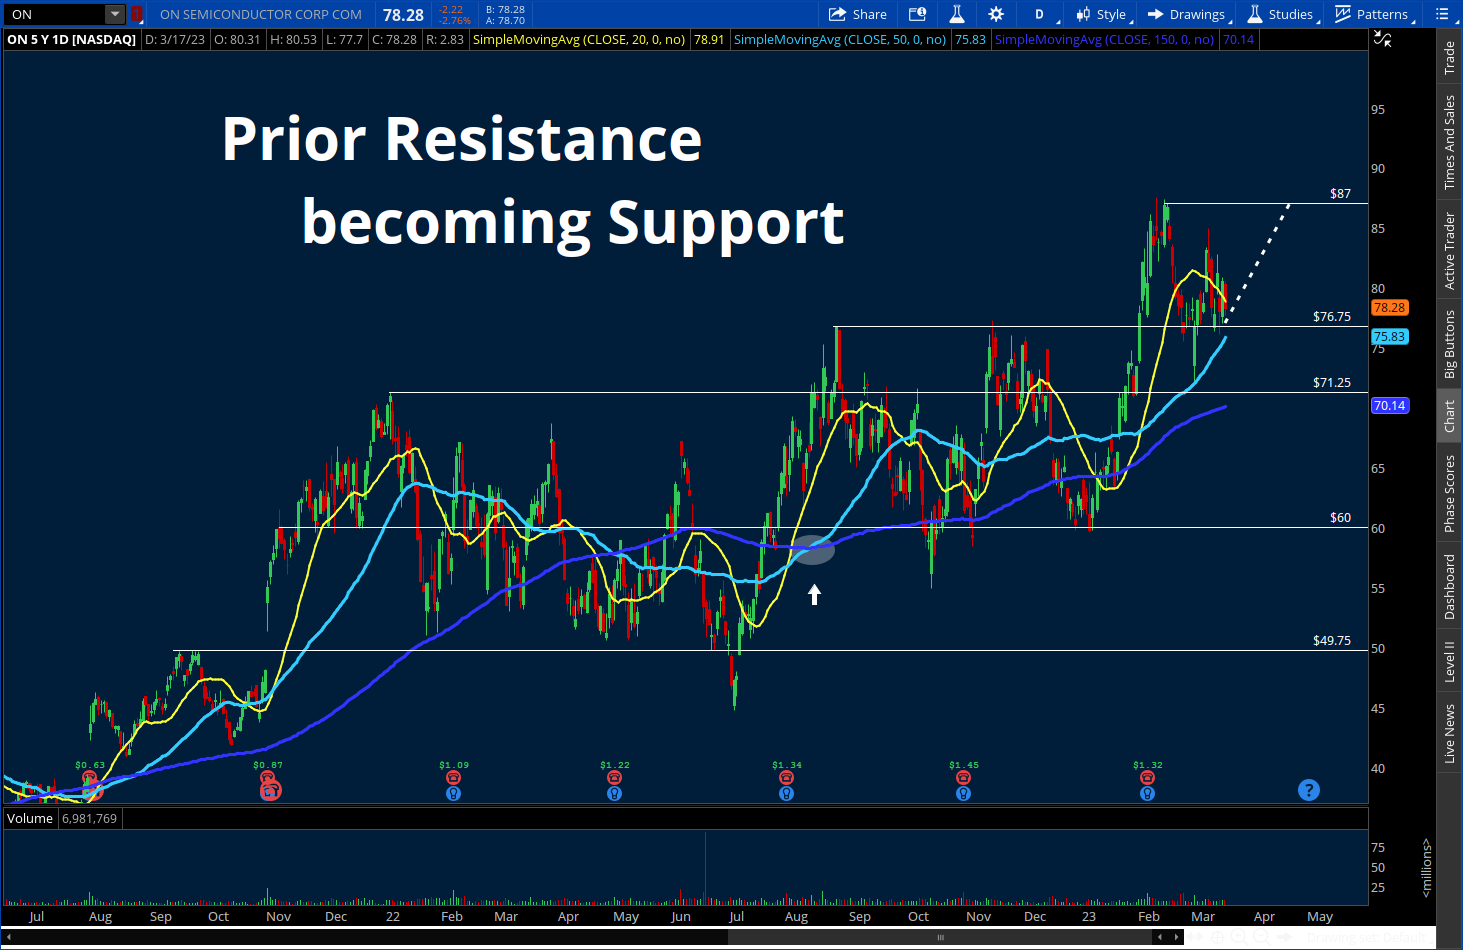
Another name in the sector that I have mentioned multiple times on Twitter Spaces is ON Semiconductor, ticker ON. This is a classic example of a stock breaking out.
There has been a pattern of prior resistance becoming support, allowing ON to find new platforms to launch higher from.
I expect the latest resistance level of $76.75 to become the next level of support, and it has already shown signs that this is the case. Price target, $87.
ON Chart
I like all of the above for long-term, buy and hold investing. I believe chips are only going to be more and more in demand as they are included in more and more industries.
Everything from cars and computers to farms and industrial equipment, microchips are everywhere.
So I started searching through semiconductor companies that might fit in to the CCS portfolio. The portfolio is just starting out which makes buying 100 shares of any of the above stocks out of reach.
What I was looking for was a chip stock, under $40, with big premiums to collect by selling covered calls. Marvell Technology, ticker MRVL, turned out to be that stock.
I started a position last week by picking up 25 shares and am going to deploy more capital this week until I’ve bought a full lot (100 shares).
Marvell Technologies, but why?
Let’s take a look at the characteristics that drove me to buying this stock for the CCS portfolio and why I think it will be a major contributor to future gains.
First, we have a defined range where the stock has been trading between $36.70 and $48.39 and the stock last week bounced off of the bottom of that range.
The bottom of a range with the bounce confirming the range is holding is where I like to accumulate shares. There is no guarantee they won’t break the range, but the bounce helps the probability that it holds up.
Second, the same pattern we saw in AMD of higher highs and higher lows shows up. It is not as pronounced, but it is there.
MRVL chart

The middle of the range is also easily identifiable, near $42, which is also where the 20, 50, and 150-day SMAs are all converging. Expect a bit of a struggle at this point.
If the shares hold near current levels, I like a few different options for selling calls.
You could stay within the week and collect roughly $45 for selling the March 24th $42.50 strike call option. That is a cool 1.1% collected in a week.
You could also consider a week further out, selling the March 31st $43 strike call option for the same 1.1% but giving yourself more room for the stock to move up. Be careful to note, you’re also allowing more time for this move to happen.
The reason I like these specific call options for the covered call strategy is the greater than 1% premium that can be collected in just 1-2 weeks while still allowing room for a 5-8% growth in the stock price.
Looking at it another way, selling the call option provides a 1% buffer before losing money on the position if the stock price drops.
One last note. When selecting which call option to sell, another good rule to follow is focusing on options with a Delta between .20 and .30. That is the sweet spot.
Conclusion
Stock selection is critical and while there are many methods to it, you can trade successfully utilizing nothing more than charts and a sound methodology.
To me, semiconductors look to be leading the way and have a strong case for more upside. Within this group, MRVL fits the criteria and shows the characteristics of a stock that will work well with a Covered Call Strategy.
When you’ve identified stocks worthy of watching, identify trading ranges to pounce on, and see confirmation of similar movement across its peers and competition, it is time to take action.
You want to get in before the breakout occurs. That is one of the goals.
Stay true to the process and you will be trading for profits.
Twitter Spaces - Chart Reviews, Trading Strategies
As I mentioned, every weekend I am hosting a Twitter Space with Shaun Clarke - @ShaunClarke_ and Kaye @InvestKaye reviewing dozens of charts and talking strategies for the upcoming week.
It is a great way to sharpen your chart analyzing skills and learn more about growth stocks, the markets, and utilizing options. Be sure to join us!
Link to this week’s Twitter Space: Sunday Chart Review Session
BIG NEWS! The Wealth Building Series is Booked
Keynote Speakers for the three-part Wealth Building Series have been scheduled.
Set your reminders! You won’t want to miss out on these brilliant minds sharing their knowledge around building wealth.
And if you missed out, check out the podcast section under A Trader’s Education for recordings of each Twitter Space.
Saturday March 4th - Financial Freedom with @TheIndependentU - COMPLETE
Saturday March 18th - Habits for Wealth Building with @DebtFreeGuys - COMPLETE
Sunday March 19th - Dividend Investing with @Smartnetworth1
Whether you just want to listen and learn or even better, if you’d like to contribute to the conversation, I would love to see you at future Twitter Spaces!
Have a great week of trading and let me know how things are going.
-Nate
I appreciate the insight, and will be tuning into the twitter space to find out more