The Magnificent 7 Are Rolling Over but One is a Buy - TSLA
Plus, trade ideas for UPST and one you've probably never heard of - NTAP.
If you are looking to the Magnificent 7 stocks to lead markets higher you are not alone, and I do not have good news. The charts point lower.
However, instead of the same names driving performance for the overall market I think we are seeing a rotation that will soon turn into higher highs with broader participation.
A few of the Magnificent 7 names will continue to perform but a couple will undoubtedly falter, and I want to know what levels to target for buying opportunities.
To that end, I thought it made sense to get the right perspective of where we are at with monthly charts for all seven. And TSLA is surprisingly the only chart that tempts me.
You also get this week’s trade ideas for UPST and NTAP.
And something I am excited about! I’ve made a table of all trade ideas available for upgraded subscribers. It is a complete list of all ATE trade ideas in one location.
You no longer need to search for the right email/post for the trade idea you’re interested in. Now you can just consult the list!
Now let’s get to the charts and the trade ideas for this week! Starting with the Magnificent 7.
GOOGL
Starting with one of my favorite long term holdings, GOOGL could bounce a little from here but ultimately I think it tests prior resistance near 144.70.
Notice the 50-week simple moving average (SMA) sliding up gradually to this level.
Instead of a steep drop, maybe we see sideways churn and a gradual decline to the 50-day SMA.
You will notice a theme with these seven names.
AMZN
The target for AMZN is 174.75 which was very strong resistance that flipped to support in 2024. I see no reason why we don’t retest this level before moving higher.
Notice that 50-month SMA again. Sliding in to act as support.
AAPL
AAPL has a couple of levels below to pay attention to.
If the bulls step in aggressively enough, the 196.45 level can hold up as it did last July. I like this level and think it does hold.
If I am wrong, 173.96 is next and the 50-month SMA is already there for support.
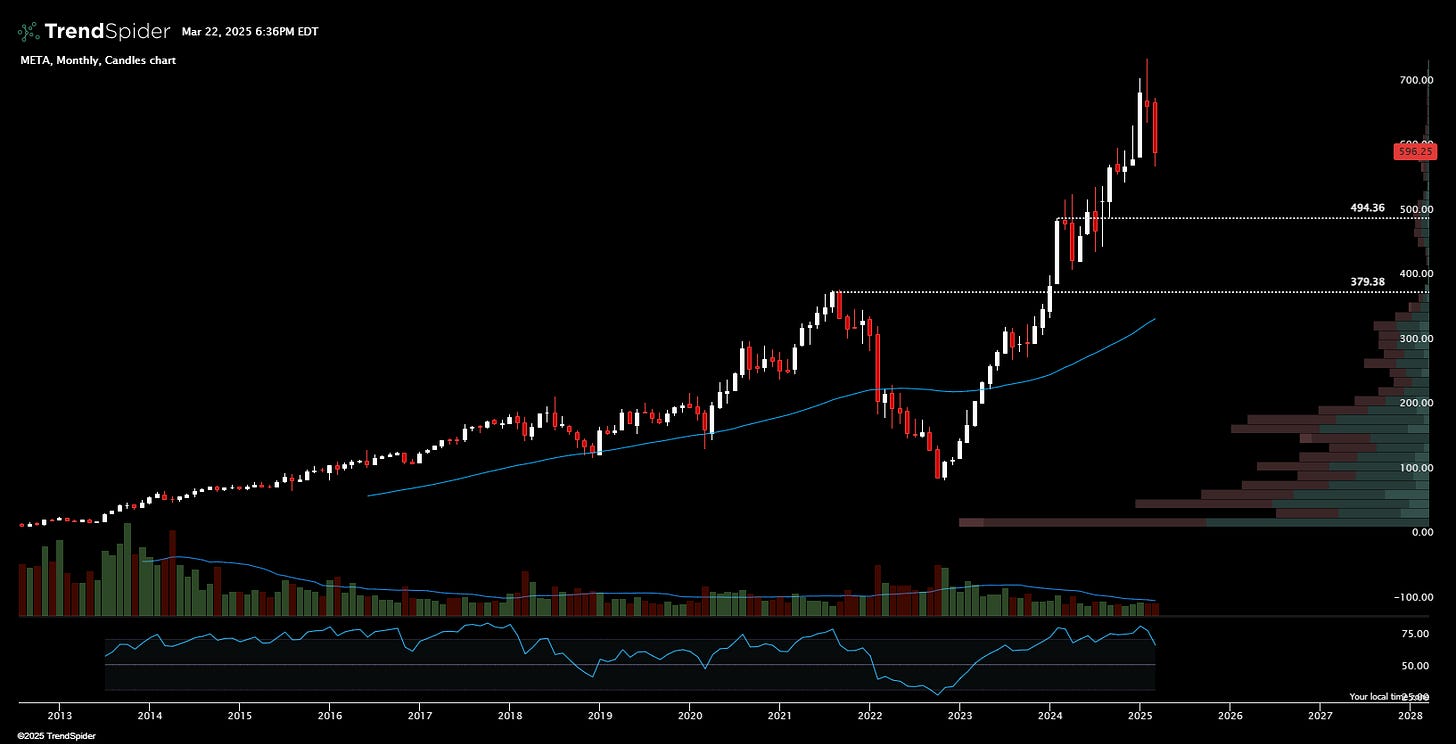
META
Like AAPL, the candles for META present two support levels.
Unlike AAPL, I actually like the lower level of support at 379.38 to be tested.
Taking a look at the relative strength index at the bottom of the chart, you can see that META is a little more overbought than the others.
This is part of why I think it drops a long ways from where we are currently at - 597.
MSFT
Not surprisingly, MSFT is a much cleaner chart wiht a much clearer support level to target.
It is also a lot closer to finding support than some of the extended levels in the names already mentioned.
Look for 336.32 to provide a floor. RSI is nearing 50 after spending a lot of time in overbought territory. I like it to rebound soon.
TSLA
Unlike the prior six names in this group, TSLA has been beaten down already.
Sitting on the 50-month SMA, buyers came in last week and with enough time left in March to push the monthly candle above the 264.51 support level.
This was a major line of resistance that now can provide a launch pad and last week could have been the start of liftoff.
If shares drop further, the next level of real support shows up at 166.67.
It is not a bad spot to take a shot at TSLA is how I am feeling about it.
TSLA is likely to be a candidate for a weekly trade idea. The chart will let me know.
This week we have UPST and NTAP lined up and ready to rip.
Keep reading with a 7-day free trial
Subscribe to A Trader's Education to keep reading this post and get 7 days of free access to the full post archives.


