


Staying Strong & Stacking Cash
When pressure is mounting, your charts become your best friend.


This service is for general informational and educational purposes only and is not intended to constitute legal, tax, accounting or investment advice. These are my opinions and observations only. I am not a financial advisor.
If you got in on last week’s trade idea for XOM you had something positive to talk about.
That really is the goal when it comes to trading. Find something positive and get in.
That is why when markets start to pull back and look shaky it becomes that much more difficult to stay in a trade.
Or when a trade like the other idea from last week, SOFI, doesn’t work out it can be easy to assume markets have turned.
If you’re feeling a bit timid after last week’s action, this week’s newsletter is for you.
Nothing feels positive on the surface when seemingly everything is red and dropping.
That is why I rely on the charts. They are your best friend in times like this.
A chart will remind you of the trend. It will remind you of the higher highs and higher lows. The chart is always there.
When you see the red tape and start feeling the urge to sell, first take a look at your charts.
After all, what are we doing spending all of this time annotating and studying if we are just going to ignore it when things get a little turbulent?
We build the charts and our trading plans so we can rely on them in the heat of the moment. When markets seem to be swirling, and panicking is easy, disciplined traders know what to do.
We look to the charts and stick to our plans. Plain and simple.
You know how I like to keep it simple.
So this week I thought it would be helpful to review a few charts and focus on reasons why you should stay in a trade as well as reasons why it may be time to exit.
Also, if you’re looking for a community sharing trade ideas for both stocks and options with an added focus on covered calls and cash secured puts, check out TNT. It's a great group!
What are the Markets Doing?
The charts for both SPY and QQQ are at precarious spots. That said, I’m not yet overly concerned.
When a breakdown in the markets occurs, levels of support and trendlines tend to be broken through with some force.
This week we sort of made our way down to just below trendlines and support.
I didn't see a lot of force or conviction.
Take a look at SPY. Yes, the lower end of the channel was breached but what else do you see here?

The bounce off of the 50-day moving average is notable. As is the open right on the 443.90 support line and push back up to close above 445.
Also, notice what is missing.
Volume did not rise dramatically on the break of trend. There also weren’t any other points of confluence to suggest a downside trade.
At least not yet.
Heading into next week, I am not overly excited about where SPY is at because it can reverse and fall even further. That said, I’m not bearish either.
It will really depend on the start of the week, more so than any previous week I’ve felt similar sentiment this year. We really are at a point of bounce or break.
Take a look at QQQ.

The daily candles are below both the trendline and 50-day moving average. Not a great spot.
Similar to SPY, there is a lack of conviction on this break so we need to see how markets react next week.
We could see a strong bounce back up above 370 pretty quickly. I’m here for it!
At the same time, we could see an equally quick drop to 357 which might create a little bit of a panic.
There is a lot of anticipation of a reversal so if it happens, I think fear kicks in and accelerates the sell off. Where this starts exactly I do not know.
And of course it may never happen, which is the best-case scenario. Markets may simply have pulled back a bit only to continue higher to close out August.
Where Support is Holding?
If your sentiment is negative heading into next week, that is understandable but I’m not sure it is correct.
There is always opportunities and the charts are where I look to find them.
While both SPY and QQQ charts are at key spots and look a little desparate, small caps represented by IWM bounced at the 50-day moving average to close the week.

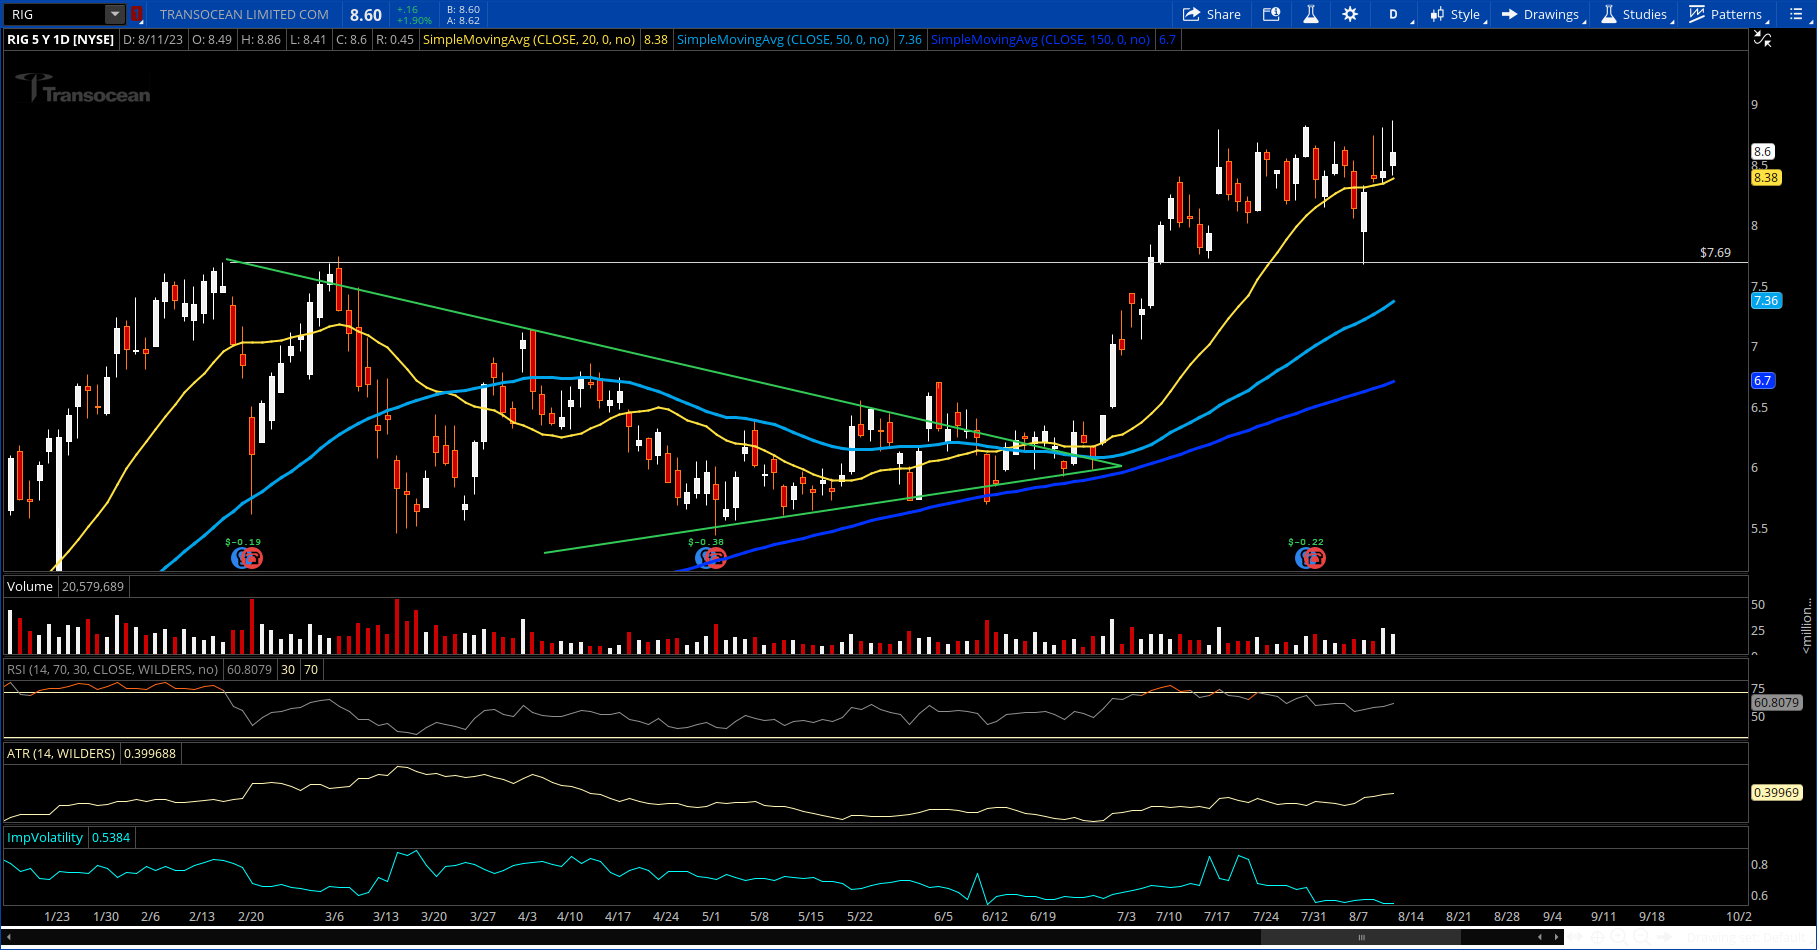
The energy sector is also heating up with names like XOM and RIG having big weeks.
I detailed the benefits of selling a cash secured put for XOM and those puts quickly dropped. A great sale if you made it!
It looks like XOM is headed back towards $115.00 per share and trading the at-the-money (ATM) call options expiring in late September is a trade worth considering.

The TNT community got the heads up on RIG this week after it touched support at $7.69 and bounced with strength. Targeting $9.55 next and I like the momentum.
Now RIG is above the 20-day moving average and looking like it is finding support, ready to bounce off of it and make a move higher.
This is a high risk, high reward trade that I like to take when I feel the sector as a whole is trending in the right direction.

I will be diving into the energy sector ETF XLE in more detail for the TNT community. Names like SLB, OXY, NVT, and of course RIG will get the full N.A.T.E. treatment.
(Notes, Actions, Targets, Execution) I know it’s cheesy, but it works!
I also noted a few additional names outside of the energy sector that found support at key levels this week. MARA and DKNG being the most noteworthy after their recent selling.
We made a lot of money in both of those names and I would not mind the opportunity to do it again.
I will be watching both this week very closely.
Conclusion
The charts this week will probably provide a lot of information pertaining to the direction of markets overall for the next couple of months.
Keeping an eye on the key levels, trendlines, and channels is the part of managing your account wisely and optimizing your gains.
Executing your plan is your follow through. Respect your stop loss levels, take the hit if needed, and move on to the next opportunity.
And it is equally important to take profits where you have set targets for doing so.
You can’t go broke taking profits. It is the worst feeling to look back on a chart you ignored to see the gains you should have banked.
While markets overall might not be showing positive signs, there are always opportunities within. You can use charts to find them.
I think energy is the sector to be studying right now. I’m already overweight and looking to add more.
Have a great week of trading!