


Small Caps: Oversold or Leading us Lower?
Selling and more selling. Small caps have had it the worst.

I mentioned in the chat that this was a great time to ease off of the trading accelerator and focus more on which long term positions you want to add to.
Pullbacks like this do not happen often and when they do you will always feel like it is the worst time to be buying any stock.
That is precisely when the most money is made.
I am not saying we are at the low. I think we are going to see more selling, but I also know that these are not chances you want to let slip by.
I added bear thesis trade ideas last week and it was just in time. META and MARA gave huge opportunities and those that got in on a short got paid.
The short-term trades are still there, and we will look at them.
That said, I really want to stress the importance of building a long-term portfolio. It is paramount to building real wealth.
In fact, if you are a paid subscriber and want to take a month off of the subscription to put that $28 towards a stock purchase, let me know and we’ll make it happen.
Ok, to the candles. Taking a look at monthly charts again, SPY definitely has the potential to drop further.

The big arrow is pointing to the 50-month simple moving average (SMA) which has provided support seemingly forever.
It makes for a nice target which also aligns nicely with the 479 top in December 2021.
That is where I think SPY is heading and I do not think it will take much longer to get there. It would complete a 22% drop from the all-time high and only 5% lower than Friday’s close.
If you look across sector ETFs you will see similar charts, all approaching or near their 50-month SMAs but still above them. This is true for most of these charts.
The candles for QQQ have the same feel and are a little closer than the candles for SPY are to touching the moving average.

You can see there is still room to drop if it is going to test the 50-month SMA for support. I don’t expect a V-shaped recovery when the Qs get there either.
It would be more likely to overshoot the line a little, recover back above it, and then bounce around just above for a while, effectively moving sideways for several months.
That entire period of time is when I will be loading up on as many shares of as many stocks as I can get my hands on. The time is coming soon.
Will small caps be the group that shows us the way back to green candles and increasing relative strength?
They certainly have been beaten down the most. Every ETF devoted to small cap stocks is well below it’s respective 50-month SMA regardless of the sector or segment.
I mentioned that nearly all sector charts are still above their 50-month SMA. The exceptions are small caps.
Starting with IWM, this chart has been in trouble.
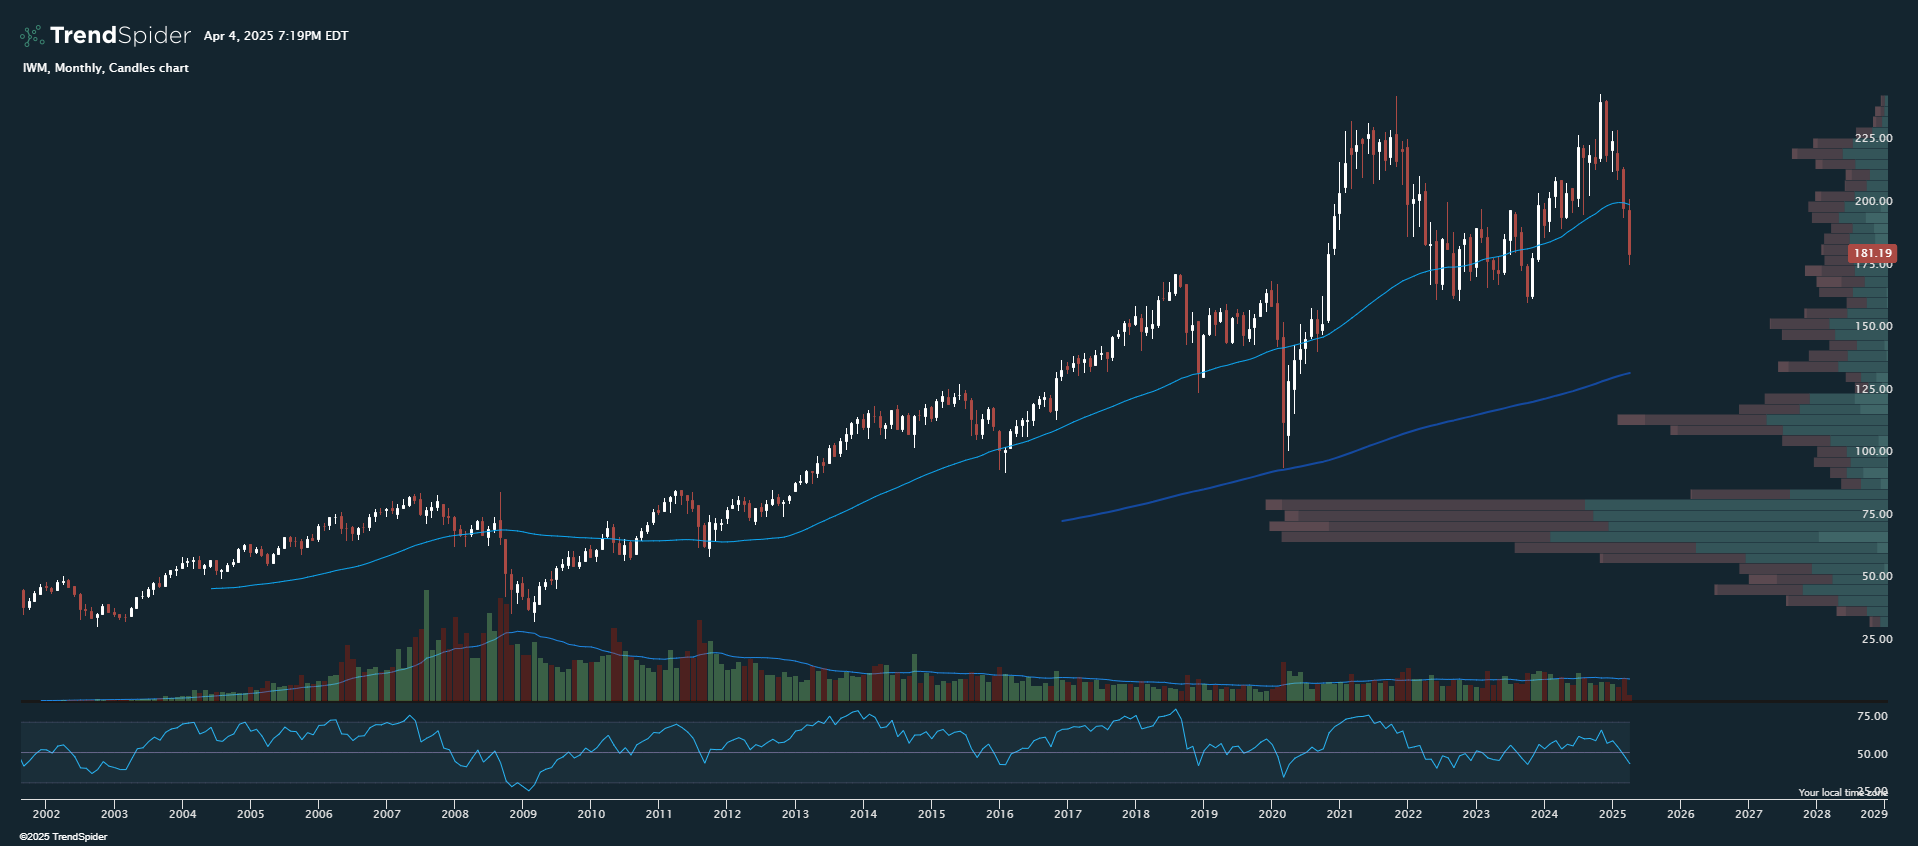
Already well below the line, there is a chance we see IWM snap back here soon. That deep drop that touched the 200-month SMA was the 2020 covid low.
Notice that we have already sold off nearly as much as the selloff in early 2020. It is both impressive and a little scary to look at.
Again, I am thinking this is probably a good time to start buying.
Will small caps continue to drop? I am not sure, but I do think they have a good chance of leading the turnaround so keep a close watch.
A few small cap ETFs to put on your watchlist include the following.
XBI
This is a biotech ETF that has not done anything for basically ten years. If this chart breaks out you would think it could run a long way. It tried once but failed miserably.

Risk takers might buy this low hoping for the bounce. If you do, be careful and consider taking small bites. The big move will come when it breaks out of the range.
This is not my favorite of the small cap ETFs though.
PSCT
Small cap tech stocks could rebound and do so in a dramatic way. I do think we churn sideways after finding a bottom, but if I am wrong and we rocket higher this is an ETF that could really run.

That is a steep drop and there is no real sign of support anywhere nearby. It could fall another ten percent before finding any real footing.
I still say put this on the watchlist because if it does rip higher, it could do so earlier than any other sector of the market.
KRE
One more small cap chart to consider is KRE, regional banks. The health of the small business owner can be judged by the performance of these smaller banks and it has not been pretty.

The candles previously tested the 200-month SMA and ultimately bounced. We could see a repeat of this which would bring KRE down to about 42.50, or another ten percent lower from here.
That sounds familiar.
I like this ETF because the options are traded heavily enough to keep the spreads tight. They’re liquid and that is what we want.
The same can be said for IWM and XBI, but not as much for PSCT. It is a smaller fund.
This really is a great opportunity to be adding to long term portfolios and is what I recommend first, ahead of any trading.
Trade ideas on the way tomorrow. Podcast revitalization not far behind.
I hope you enjoy a relaxing weekend.
-Nate

I am an affiliate because I use and benefit from the tools they provide. Anchored VWAP is just one of the many top features I utilize every day. Check them out!
This service is for general informational and educational purposes only and is not intended to constitute legal, tax, accounting or investment advice. These are my opinions and observations only. I am not a financial advisor.