


Sectors Looking Strong Heading into October
Get in on the sectors that are HOT! And avoid the ones that are not.

This service is for general informational and educational purposes only and is not intended to constitute legal, tax, accounting or investment advice. These are my opinions and observations only. I am not a financial advisor.
It is great to get the third quarter behind us. The past two months have been anything but friendly.
That said, I like the opportunities in front of us. If these charts are any indication, we could see some nice upside to kick off October.
There are a couple of sectors the bears will point to as well. Not everything is poised to move higher.
This week will be chart heavy and the first one up is a look at IWM, the iShares Russell 2000 ETF.
I like looking at small caps because if they are not healthy, the odds of a strong rally for markets overall are also not healthy.
Last week IWM bounced nicely off of the trendline, and I like a push higher here.

The semiconductor sector has rolled over after making highs in July with August and September continuing lower for ticker SMH.
There was a nice bounce off of the 150-day simple moving average which is nice to see but there is a lot of resistance above.
If shares can close firmly above $150 the follow through for more upside could be huge.
If shares reject at this level it would be understandable given the 50-day moving average and huge volume shelf right at $150.

The biotech ETF XBI is struggling to hold above $71.60 and if it breaks below this level I think it could get as low as $61.69, the lows from over a year ago.
There was a small bounce last week which could see shares push back towards $78 but I am not convinced the pain is over yet for this ETF.

If you have been following along on X you know my favorite sector right now is energy.
Ticker XLE continues to power higher but did check back hard to close last week. This was expected as noted by the forecast line.
I like a push to retake $93.15 and then a move towards $95 shortly after. This sector is still cooking!

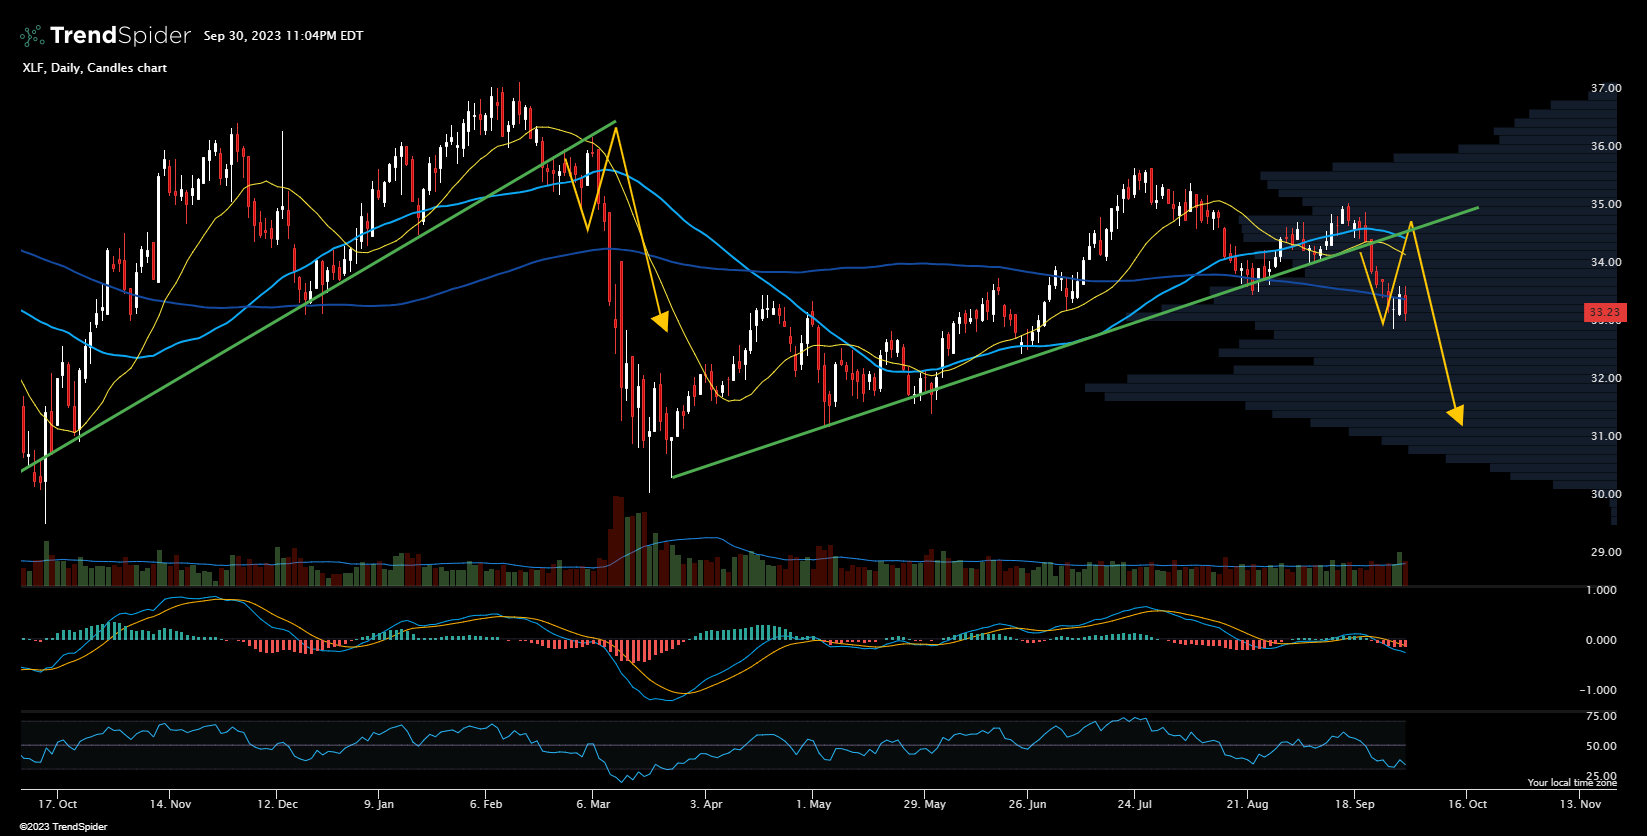
Financials will kick off the next earnings season. I’m not too excited about the chart of XLF though.
The uptrend broke and now we could get a retest of $34.50 but I would expect a rejection.
The 50-day simple moving average as well as the 20-day are both providing resistance overhead. The trendline also acts as a rejection point.
RSI is low going lower and MACD just dropped into negative territory. I’ll be staying away from financials for now.
I would like to remain bullish on healthcare and ticker XLV is where I look for signs and information.
Last week it closed just below the trendline that goes back one year. We saw nice bounces off of this trendline earlier this year.
Will we see it again or will shares break down? Definitely worth watching.

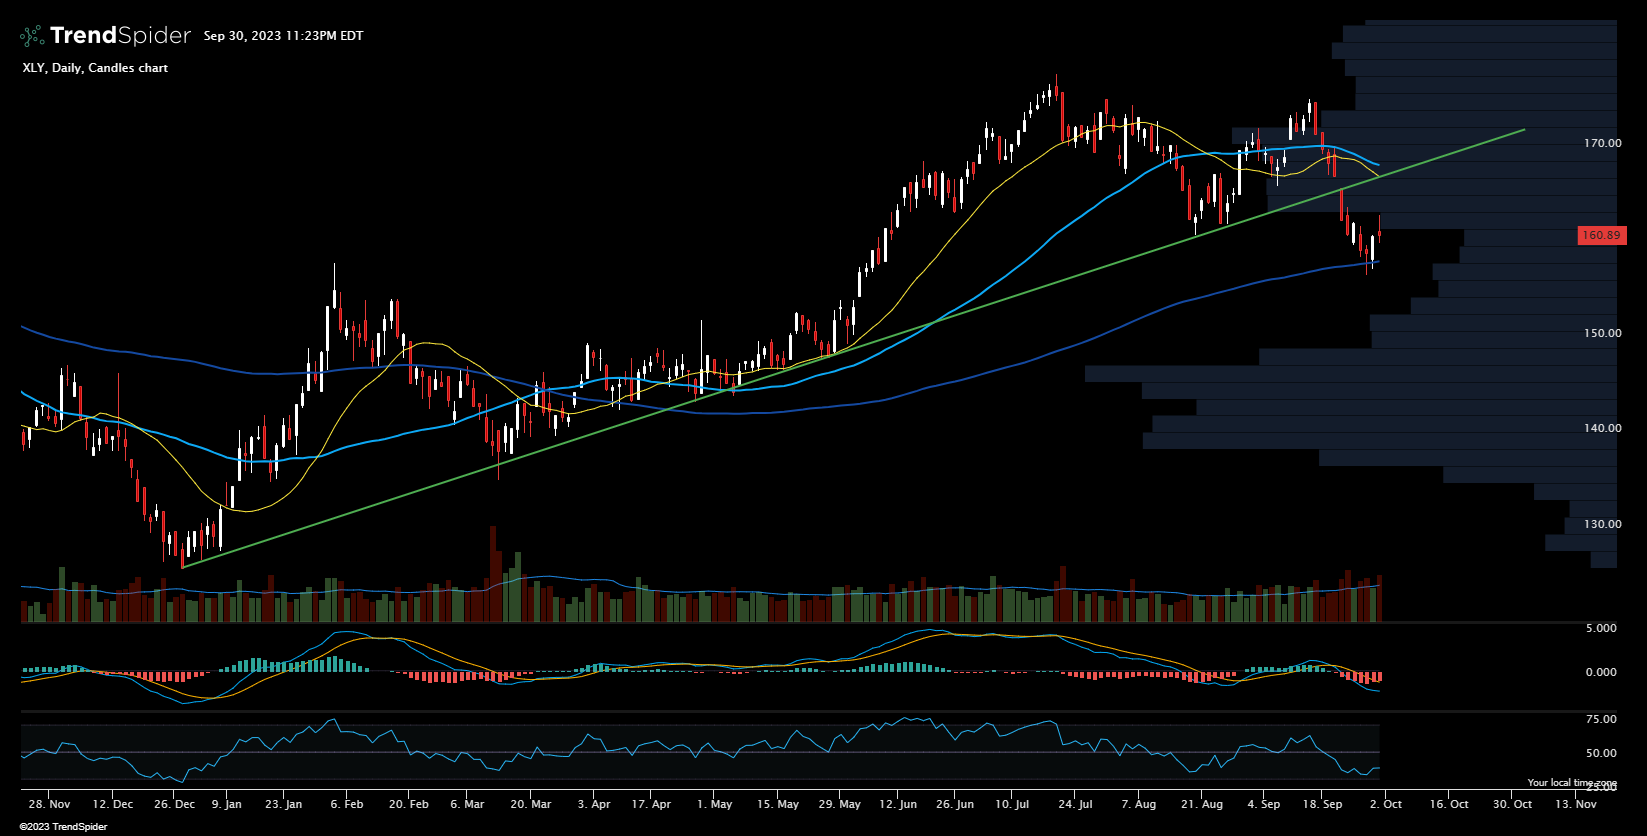
And the last chart this week covers the consumer discretionary sector.
Ticker XLY.
The 2023 trend has broken and shares are down and closed just below $161 after hitting recent highs above $175.
Shares did bounce off of the 150-day simple moving average and will need to power back above the trendline (and 50-day SMA) to keep on the bullish track.
Let the Charts Show You the Way
I wrote this a week or two ago and I think it is worth repeating.
Regardless of which opportunity is presented, a technical trader has a pretty simple job.
Have a plan, follow the plan, and do not try to do too much.
For example, you might consider taking a long position after QQQ held and bounced off of 354.71. However, if this level breaks you know the set-up is no longer there and you can move on to the next chart.
There is no need to consider how many rate hikes there will be or how unemployment will look.
Trust in the charts, become an expert at identifying patterns, and maintain a strict discipline around your trading plans.
These are steps I can understand and follow.
Have a great week of trading ahead and thanks for reading!
-Nate