


Sector Review: Biotech, Banks, Energy & More
This is where you will find your best trade ideas for both upside and downside.
Are you still surprised by the constant move up or have you been trading the trend and enjoying these new all-time highs?
It sounds like there are a fair number of traders on both sides.
Some are calling for higher highs behind the strength of NVDA, all things AI, and big tech.
Others are pointing to the relentless push with little to no relief, believing we must have a healthy pull back soon.
You know I am just going to trade the chart in front of me. So, let’s take a look at a bunch of them and see where the opportunities are at.
First, take a look at this daily candle chart for SPY.
SPY

The intent is to call out each big daily move higher, including the gap up in early November that really got this rally going.
Notice that after the big moves we have not see an immediate pullback. Instead, you can see quite the opposite.
As long as the daily candles remain above the rising 5-day simple moving average (SMA) I expect to see the same continuation higher following these big days.
Instead of feeling like these 2% market moves in a single day are overdone, the market is reacting as if they are signaling a risk on sentiment which is followed by more buying.
I will be wrong when the market reverses. I would prefer to be wrong at that one point than guess and be wrong multiple times on the way to higher highs.
QQQ
Taking a zoomed in look at QQQ, the 2-hour candles show key support and resistance levels to pay attention to at the start of next week.

The Qs closed the week at 436.78 and then drifted a little lower after the bell.
I am looking for a reaction on Monday, with a clear break above 440 being optimal for the bulls.
A break of this level would welcome a retest and if it holds we could see even more buyers step in quickly.
I think it is more likely that we see a little more selling first and I am watching 432.08 to see if it will hold up as the first level of support.
If we do see a bounce at this level it would set up for an attempt at new all-time highs yet again.
The next area of support can be found at between 425-428.
A bounce at these levels would keep the bears in check but a break below would have me taking another look at the chart.
QQQ would still be above the 50-day SMA if it fell to 425 next week. Hardly a signal for a huge reversal.
IWM
Small caps are trying to give us all more reasons to be positive.
The key level for IWM is 200. There is not much more to it.

If IWM can get above 200 and hold it for more than just a few minutes, the next step would be a push above 205 on strong volume.
I have my doubts about this one though. You will see why when I get to the chart for the regional banks.
If the regionals are not doing well, it is likely a good number of small caps will be struggling and is also not the best signal for the strength of the economy.
XBI

The XBI breakout is starting to take shape.
Upgraded subscribers are already well aware of this trade and if we see a continuation higher next week the moves could be big.
If you haven’t upgraded yet, give a free 1-week trial a shot.
You are not going to find more trade ideas, complete with entry, exit, stop loss, and profit taking levels all for only $8 per month.
My trading is accelerating the growth of my retirement account.
I hope my newsletter accelerates my ability to leave my 9 to 5 and write full time.
Thank you again to all of you who subscribe!
Ok let’s keep it rolling with more charts.
XLF and KRE
If you are only paying attention to the big banks in the financial sector you might think everything looks great.
For most of these names, that is true and it is reflected in the chart for XLF.

Names like JPM, WFC, and BAC have all marched higher since the October lows and there is real momentum in the sector.
Now take a look at the regional banks. These are the banks that work with small businesses, deal with commercial loans, and are a decent pulse on the strength of the communities they serve.
Here is the chart for KRE, a regional bank ETF.

That chart tells a completely different story and until the trend is broken, this is not an area I want to trade for upside.
If you are looking for names to short, this is the sector I would consider first.
With KRE right at the trend line and rolling over again, you could look at put contracts for the ETF.
Top holding include HBAN, CFG, RF, TFC, MTB, and WAL.
XLC
The communications sector is known for being a two headed monster, with META, GOOG, and GOOGL making up nearly 50% of the fund.
These two companies are not the only thing cooking in the sector though.
The daily chart shows the ceiling at 80.22 for XLC that is attempting to be broken.
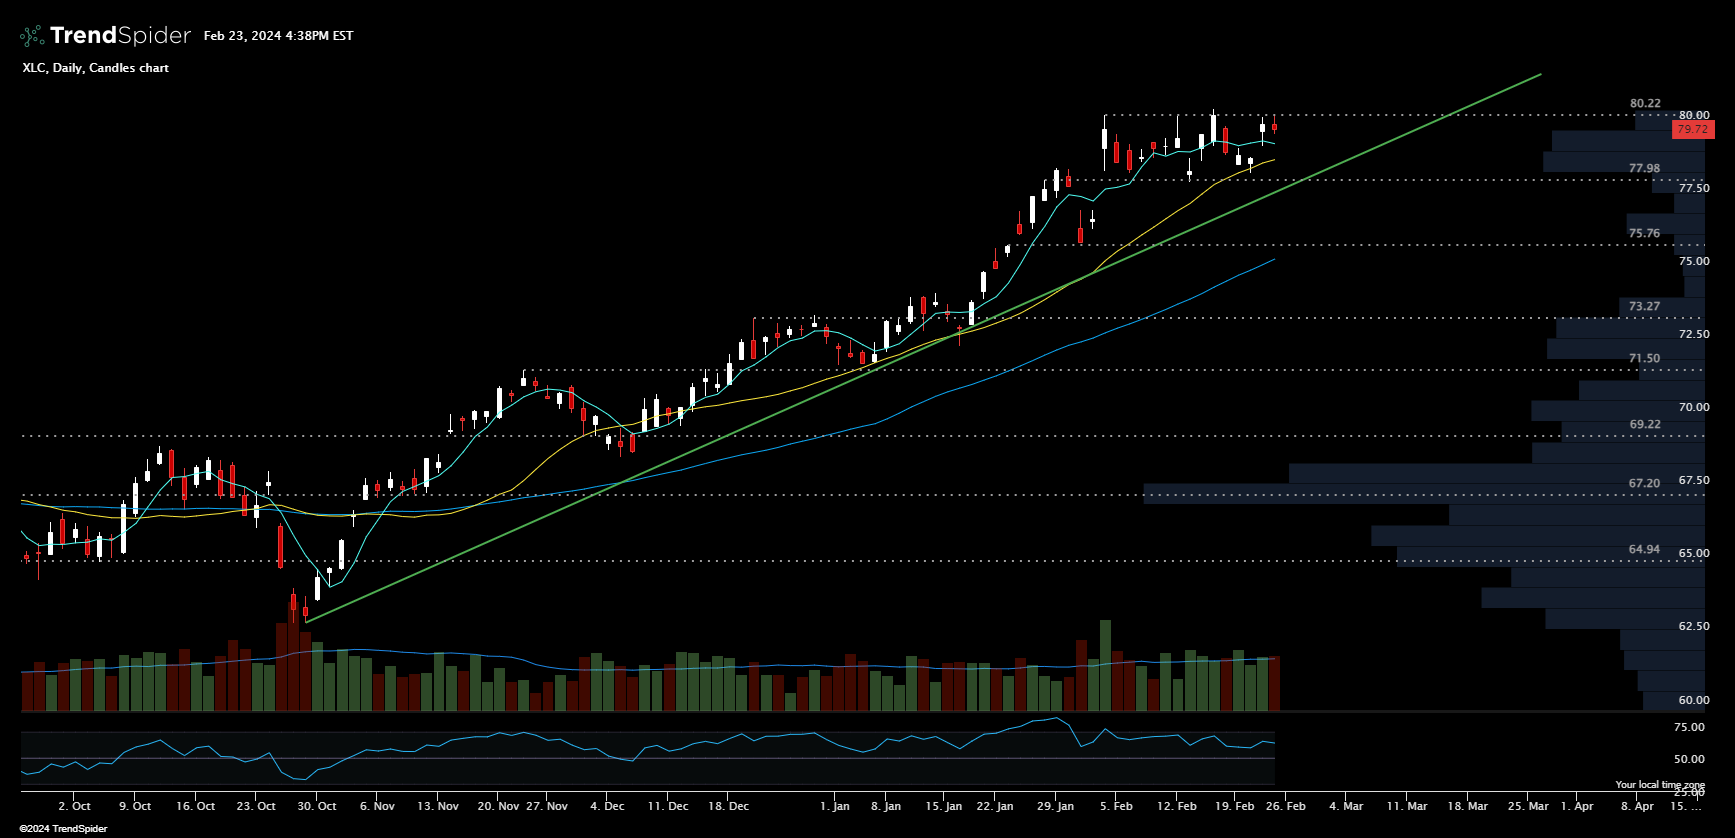
I am watching for a breakthrough and retest of this level before a continuation higher.
I like the way the charts for top holdings TMUS, NFLX, and DIS are setting up and if rate cuts show up this year you could see names in this sector known for their yield start to make a move.
I think there is a lot to like about this sector and have been talking about it since November of last year.
XLE
Another sector I talk a lot about is energy.
I like the way the chart is setting up for the energy sector ETF, XLE.

The key level here is 86.11 which has proven to be tough resistance.
Notice the breakthrough of the downtrend and attempt to close above resistance, which is exactly what energy bulls are looking for.
If we do see this sector start to break out, top holdings XOM, CVX, COP, EOG, SLB, and PSX will be worth looking at.
I also like a few names that are a little less known. A few examples are VNOM, PXD, ET, and MPC.
This sector has my attention, there is no doubt about it.
You may have noticed that I have left off semiconductors.
Do not worry! This is still my favorite sector for the long term and it has treated us really well recently.
I do think it is worth taking a cautious approach to this sector at these levels. The run has been incredible and there will be more opportunities.
I hope you are enjoying your weekend!
-Nate
When you are ready for TrendSpider, please use the link below to sign up!
Anchored VWAP is just one of the many top notch features TS provides.
Check out TrendSpider and let me know if you have any questions.

This service is for general informational and educational purposes only and is not intended to constitute legal, tax, accounting or investment advice. These are my opinions and observations only. I am not a financial advisor.