


Maximize Profit by Staying in the Trade
Using EMAs and trading levels to stay in a trade is how I maximized CCL gains

Taking a quality entry is definitely a big part of successful trading. It is where the possibility of winning trades is created. Staying in winning trades is how profits are maximized. This is not something many are good at but there are ways to utilize EMAs and trading levels to keep you in winning trades longer and for added gains.
How did we get here to begin with?
Choosing CCL this week was largely based on two signals. The candles struggled at a key resistance level which showed us the first sign of weakness and got CCL on the list of potential trades. Exactly the set up highlighted for C&C Members.

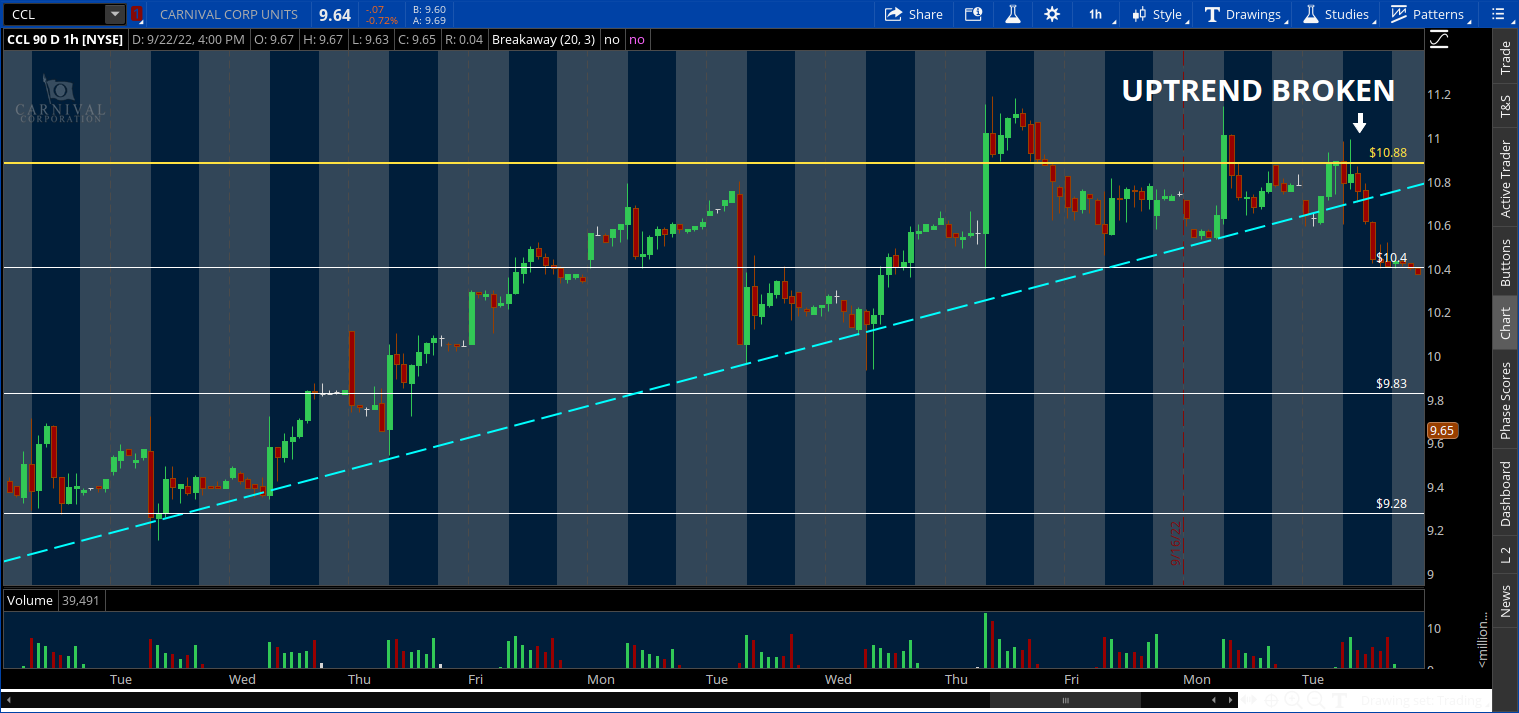
And the uptrend that has been in place for a couple of weeks finally broke Tuesday giving confidence to take the trade.
Here’s the resistance…

And here’s the trendline and where it broke Tuesday, followed by me buying puts and telling anyone that would listen to do the same if they had a few extra dollars to risk.
So that’s how we got CCL on the radar and got into the trade. Taking profits is also part of the equation though. Taking them too soon leaves money on the table but waiting too long can give it all back. As usual, I take a simple approach.
Staying in Profitable Trades, Riding Winners
Tuesday was the first opportunity to buy CCL puts with confidence after the candles rejected an attempt at getting above 10.88. Really it was an attempt at the high of the day that failed miserably and broke the uptrend, kicking off the selling.

The candles break lower, so when is the right time to sell and take profits? You can use the EMAs (exponential moving averages) as trading guides. But what do EMAs represent?
In short, an EMA is a price average that indicates trend. When the trend is broken, the candles tend to change direction. That’s the signal to get out of your trade. I like to use the 9 EMA, 20 EMA, 50 EMA, and 200 EMA with the first two being my primary indicators for exiting short term trades (What are EMAs and How to Use Them).
Without a signal, we stay in the trade like we did with the CCL puts Tuesday. Note in the chart above of the 5-minute candles that after the rejection, the candles remained below the 9-EMA until the very end of the day. Even then, they never really attempted to push higher.
The Swing Trade is On Like Donkey Kong
After struggling to get above 10.88 on Monday, the candles tried again Tuesday but failed giving you a second chance at taking entry with puts after the trend break described above. The failed attempt at 10.88 Tuesday was my biggest reason for getting into puts and trading the downside this week.
Failed attempts at overtaking resistance levels are a great signal to take a short position with greater probability for a successful trade. For CCL, we had weak closes after rejections at resistance nearly every day. Then both Tuesday and Wednesday close near the low, super bearish, with Tuesday holding above the 10.40 level giving traders pause. So what do we do?

Remember, the trend broke Tuesday after failing again at 10.88 which is what got our attention. Wednesday could have been a small loss had the candles reversed. This was the risk taken. But it was a good risk to take because we had multiple pieces of information behind the trade (trend break, rejection at resistance) signaling more downside was likely. WOW we sure got it!
The Rest of the Week was for Profits
Wednesday’s candle broke through another support level at 9.83 and closed below giving another reason to stay in the trade. Continuing to close at the bottom of the day’s range and below key levels provided plenty of reason to hold the puts even through the incredibly choppy trading session.
When the candle closes near the bottom of the day’s range, meaning there is no wick underneath it, this is typically a bearish signal. The sellers kept the pressure on right up to the close and tend to show up the next day to continue the job. The same can be said when the candles close near the top of the day’s range. The odds of a continued push to the upside are higher.
Thursday is where most of us got chopped out of the trade with the candles closing only slightly below the open with long wicks on either side. This candle shows indecision and could have seen a reversal Friday, no doubt about it. However, the close below 9.83 and overall trend to the downside gave reason to stay in.
Friday’s open below 9.28 support and rejection when the candles tried to recover back above this level was the icing on the cake. The long lower wick, again, gives reason to close out the puts and wait to see what happens Monday. No reason to push it given the buyers are showing their hand.
The entire week was nothing but profits for those that used EMAs and trading levels to stay in the game and there is no need to sit on them over the weekend only to worry about what happens Monday. Unless you’re into that sort of stress. Then you do you!
NEXT WEEK: Trading TSLA, SOFI, SPY, XBI
Interesting set ups for TSLA as it closed just below $276 which has been decent support. Bounce or break, that is the question. SOFI also testing support in a major way so we’ll break that down. And a shift away from stocks this week as both the SPY and XBI present interesting opportunities if we get a nice rebound after the selling this week.
Have a great weekend everyone!