


Loving the Energy in Energy Stocks
Cash from dividends and options plus recent outperformance, I like this sector.


This service is for general informational and educational purposes only and is not intended to constitute legal, tax, accounting or investment advice. These are my opinions and observations only. I am not a financial advisor.
One is good, two is better, and three is best when it comes to trading.
Gains (1) are good.
Gains plus added yield (2) is better.
Gains plus yield plus options premiums is best (3) for your portfolio.
And there is good news! You can capture this trifecta in the energy sector.
Simply put, I see opportunity.
We looked at semiconductors last week and this week the focus is on energy. That might seem odd to some. I get it.
So, what is with bouncing from one sector to another?
Well, I still like semiconductors despite the sell off post NVDA earnings. This sector has huge upside ahead.
But I also like energy and can’t ignore the charts, which we will get to.
Energy names also typically offer a nice yield, with dividend payments often between 3-4% and sometimes higher. That’s more cash in your account.
Trading is about finding opportunities and pouncing on them, and doing so without bias. I may not be a huge fan of a certain sector in general, but what matters most is going where the trading is best.
Energy has a few names that have caught my attention. But let’s start with XLE, the energy sector ETF.
The chart for XLE shows the 50-day simple moving average (SMA) crossing above the 150-day SMA which indicates bullish momentum.

The last time this bullish signal flashed, shares of XLE popped from $78 to $94 in just one month.
I would expect shares to first test the 50-day SMA near $85 before bouncing and continuing higher and that is exactly what I am looking for.
Finding Support before Filling a Trade
One of the hardest things to do in trading is to be patient, so it should be no surprise that those that have patience to wait for the right set ups often reap the biggest rewards.
Seeing the 50-day SMA cross above the 150-day SMA is a great signal.
Another great sign is the hinge in RSI, turning directly up. You can look back in the chart and see nearly every other time a sharp reversal in RSI occurs there was some follow through to the upside afterwards.
MACD is also firmly positive, another show of strength for XLE.
But now is not the ideal time to enter a trade. The ideal time is when shares find support, which is why I’m watching the 50-day SMA so closely.
How shares trade around the 50-day moving average is something traders and investors pay close attention to. Support here is crucial for more upside in the near term.
Adding in support levels, you can see that XLE previously found support (and resistance) multiple times near $83.

Shares have not exactly respected the 50-day SMA for XLE and there is always a chance that it is broken through but shares quickly recover.
That is where the $83 support level comes in to play nicely. This set up allows for an initial partial position to be taken near $85 if the 50-day SMA provides support.
The next step in the plan is then to either add more on support near $83 or cut losses if shares drop below this level.
There is one last piece of information you can wait on to feel even more confident in a move up.
Wait for a break of the recent downtrend. Here’s the line that needs to be broken.
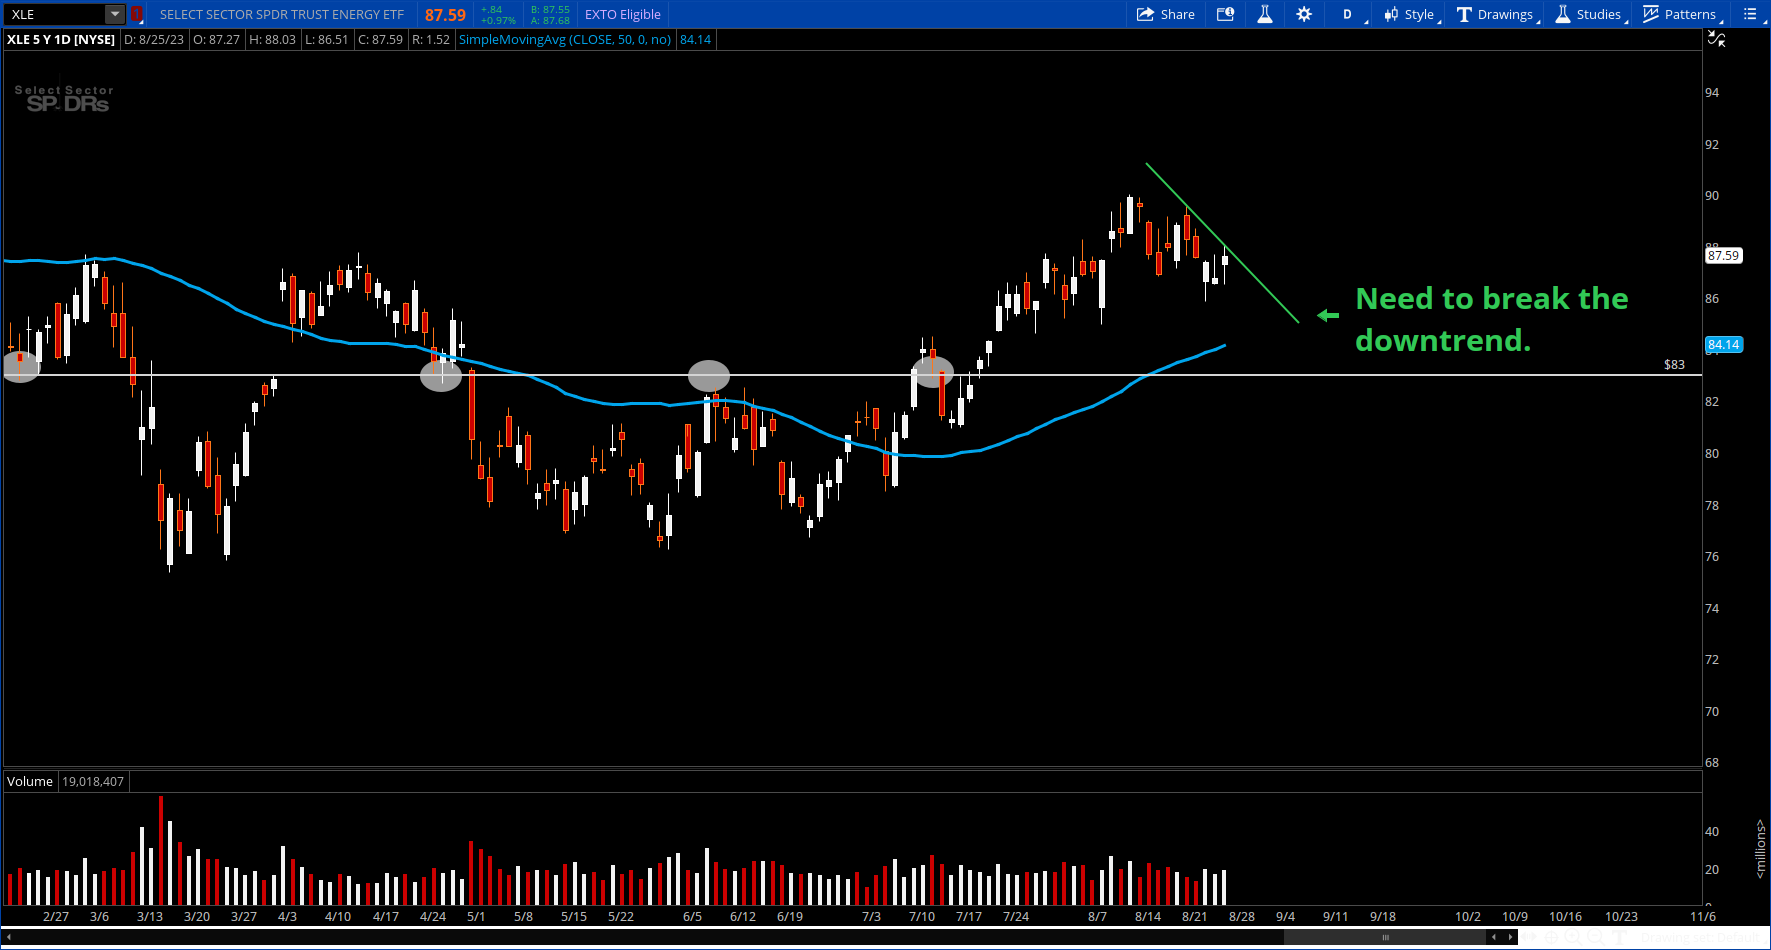
This is simple technical analysis that can keep you out of losing trades and help you get into trades at ideal spots from a risk management perspective.
Right now, there are indicators and support levels showing up in key spots throughout the energy sector.
I’ve zeroed in on the energy names I am looking to trade in the coming weeks/months: LNG, SLB, and SHEL
Let’s get to the notes, trading plans, and price targets for each.
Keep reading with a 7-day free trial
Subscribe to A Trader's Education to keep reading this post and get 7 days of free access to the full post archives.