


Confident Trades Creating Big Profits
Trades that were never in doubt and how I was so sure they would work.


This service is for general informational and educational purposes only and is not intended to constitute legal, tax, accounting or investment advice. These are my opinions and observations only. I am not a financial advisor.
You click the “buy” button, the trade is filled and immediately drops in value by a couple of points. How do you feel? Not so great?
You might even mutter “here we go again” as you watch the trade move the wrong direction seconds after you entered it.
A bit of sweat on your temple, a tight stomach, a desire to stare at the screen or refresh it repeatedly until things turn around.
This is no way to trade.
There are two primary reasons a trader will feel instant regret or anxiety after entering a trade.
Taking too large of a position - risking too much
Taking a trade without enough information - lacking confidence
The first is easy enough to address. Personally, I try to never put more than 5% of my total account value into a single trade.
Some will suggest more or less than five percent. The key takeaway is, figure out where your comfort level is at and stay within that level.
The size of your trade should also factor in the amount of information you have heading into a trade. I will definitely allocate more capital if I am able to build enough confidence heading into the trade.
Building Ultimate Confidence
The goal is to feel great about every trade you take when you take it. If you don’t feel this way, why would you take the trade?
You’ve heard it before. Hope is not a strategy.
Let’s add that gambling, throwing darts, wishing, praying, waiting on alerts, and going in blind are also not strategies.
The only way to trade successfully over the long term is to trade informed at all times. If you don’t have enough information, don’t make the trade.
Nothing guarantees success, but the idea is to always put the odds as much in your favor as possible.
This is how you enter trades without the sweat, anxiety, and feelings of a rigged market. It is all about information and improved probabilities.
There is so much to sort through, it can be difficult to know what information to pay attention to and what is in the noise.
I stick to what is simple, effective, and easy to understand. There is no need to overcomplicate things or pretend that I know more than I do.
I stopped trying to analyze balance sheets, income statements, and things like “total addressable market” or spending time on future earnings growth predications. This has never helped me with trading.
In fact, I’ve met exactly zero people that are consistently good at this type of analysis and that includes the Portfolio Managers I worked with at a fund managing billions.
There are simply too many factors and even more sneaky, unorthodox ways to hide or skew the numbers that I find it all to be unreliable at best.
This is why I prefer to lean heavily on charts and the large amounts of objective information that you can pull from them.
You can’t hide price or volume in some footnote the way you can to hide liabilities on financial statements. The chart is the chart.
I’ve also started to utilize a tool that adds additional pieces of information to further build confidence before taking a trade. More on that later.
Let’s take a look at my trading this week and what information was used to have ultimate confidence heading in.
Charts Are Where the Info is At
There is so much information, and therefore confidence, that can be gained from a chart.
It is up to you to wait for the chart to unfold, allow the information to present itself, and then correctly identify the trade when it does.
The good news is, there is no manipulation of numbers or multiple pages of data to sort through. You just have the chart and all that it provides.
The first thing I look for is trend. Are the candles forming a defined trend in either direction that I can capitalize on?
One rule I try to always follow is never fight the trend. Please trust me on this.
So much money has been lost trying to fight the trend or pick the exact reversal point. I advise against trying these hero trades.
When I am scanning charts for each ticker on my watchlist, one of the first things I am looking for is a defined trend. It doesn’t matter the direction, as long as it is clear.
The candles for CPNG, which are in a longer-term downtrend, have recently entered a clearly defined uptrend for about a month which got the ticker on my watchlist.

On April 14th I noted the uptrend and the pullback which gave an opportunity to enter a trade for more upside.
The second note taken after looking at the daily candles for CPNG was the bounce off of support provided by the 50-day simple moving average (SMA).
Where the price is at relative to the 50-day SMA and how it reacts to this moving average can provide a lot of useful information.
If the candles bounce and follow through, it is a strong sign that the price at the 50-day SMA is strong support which is what we got.
A third initial note was the SMA crossover, with the 20-day SMA moving above the 50-day SMA. This is a near term, bullish signal.
When the shorter 20-day moving average crosses above the longer 50-day, it shows that the trend in price has shifted up and done so with some consistency.
Sure enough, after seeing all of these signals the price of CPNG gapped up (opened higher than the prior close) from $15.58 to $15.67 and then ran for two more days of positive moves before peaking at $16.45, a total increase of 5.6% in just a few days.
But the trading didn’t stop there.
After the nice run, the price pulled back and gave up quite a bit but not all of the gains from the initial bounce off of support.
This formed a higher low, another key piece of information.
A higher low is when the price drops and then stabilizes but at a higher level than the prior established low price. This is an indiation that buyers are stepping in and adding to the bullish momentum.
While forming the higher low, two candles had long lower wicks which is an additional indication of demand at this level. The buyers were not allowing for a lower close on either day, driving the price back up after initial selling.
In addition to the higher low and multiple long lower wicks, the candle mid-week closed above the $15.91 resistance level.
This was another sign of strength as resistance was broken and the price held through the close.
Often you’ll see a break above a key level only to be let down by an immediate reversal and close below. It is important to get the follow through and close above the line to establish confidence in the support behind the trade.
I want to reiterate how important this is. You must see a close above resistance and the follow through to have ultimate confidence in the move. Don’t fall for the fake breakout.
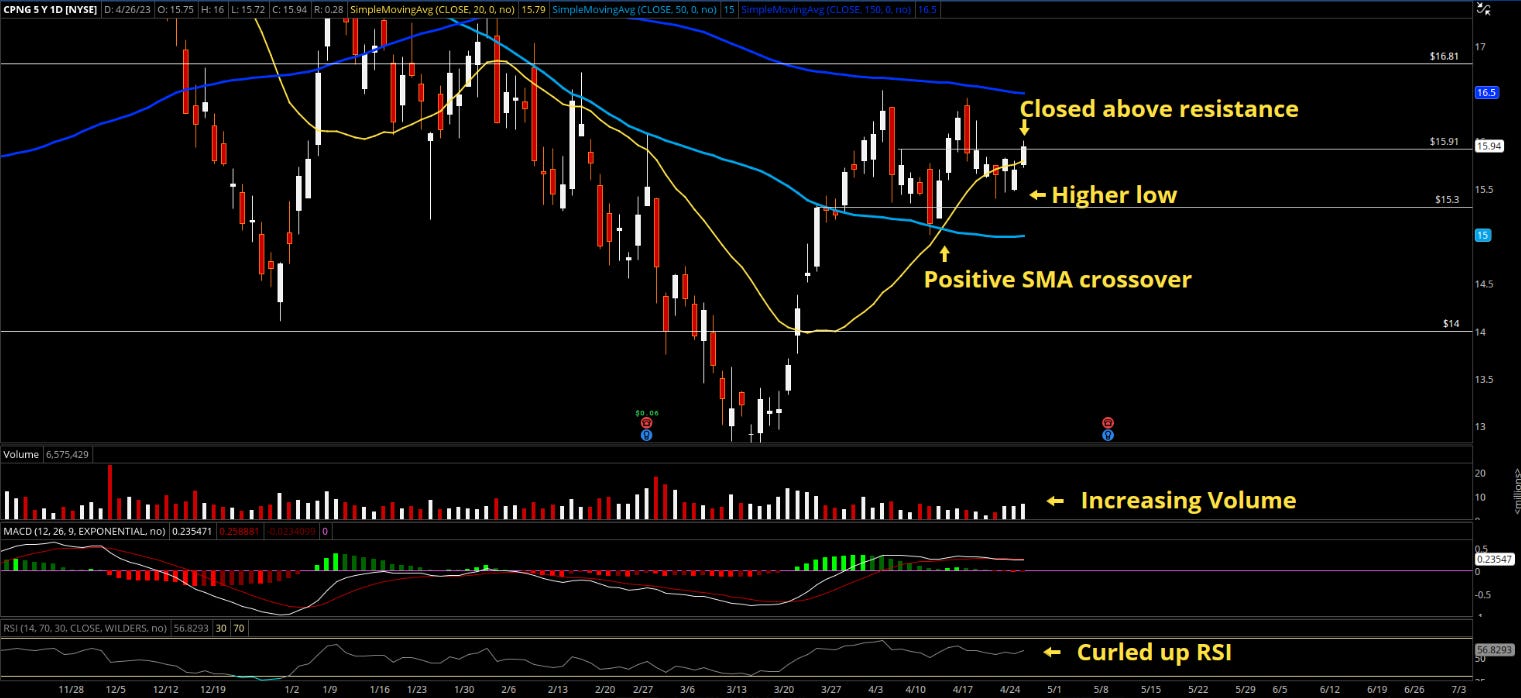
The moves up for CPNG were on increasing volume which only adds to the conviction of the move. This is the increasing volume you want to see with a break through resistance levels. Again, it shows strength and the ability to follow through.
Another indicator that I like to use to reinforce where the trend is at is MACD. When it is positive, the price has upward momentum. That is what we see with CPNG.
MACD can and will “curl over” which will be shown as the shorter duration average crossing below the longer duration line. This is a signal that the trend may be reversing.
We didn’t see that with CPNG. Instead, MACD remained firmly positive and added confidence heading into the trade.
The last indicator on this single chart is the relative strength index (RSI). RSI shows relative strength of recent performance.
Increasing RSI is a positive signal, especially when it still has room to move higher before hitting 70 which is generally where stocks can be seen as “overbought” and likely to cool off.
The RSI for CPNG was at 56 and curled up, a perfect set up for a move higher because it showed high relative strength with room to move higher.
To recap all of the information gathered from the chart of CPNG before entering a trade, we have:
An established uptrend since mid-March
Bounce off of support - the 50-day SMA
SMA crossover, 20-day above the 50-day
Higher lows established
Long lower wicks on the established low
Close above $15.91 resistance
Increasing volume on the move up
MACD remains positive and strong
RSI curled up with room to go higher
All of this from one chart!
If you gathered this information and decided to enter a trade on it, you could have entered at the high of the day on Wednesday and seen the shares pull back.
This is exactly how my trade went.
Did I get anxious? Any tightening of stomach muscles or constant rechecking of the share price?
Not a chance.
Look at all of that information I had heading into the trade! That is more than enough to feel incredibly confident despite an initial pull back in price.
And the information paid off as CPNG gapped up on Thursday, continued higher, and then had a huge day Friday to close the week right at the next higher level of resistance which comes in at $16.81.

One last piece of information is the resistance level at $16.81. Why would you hold your entire options position over the weekend when you are at resistance?
You shouldn’t.
This is why I closed out the call options I was in, collected the 67% gains, and did not continue to roll through next week with more call options. That would be greedy.

I do own shares which allowed me to sell covered calls at the $17 strike. When shares are at or near a resistance level I like to collect some added cash by selling calls.
This is not because I am certain the stock will reverse. I am taking profits because we are at a new level and the information is less certain.
Yes, the uptrend is still holding and there is enough information to remain bullish in the near term. That is why I am still holding shares.
However, it would be over doing it to ignore the quick profits in the call options and hope for more to start next week. I can’t imagine enjoying the weekend knowing I could have locked in that cash but didn’t.
Getting ultimate confidence from a ton of information pointing in the same direction is a great set up for profitable trading. Following through is how you realize those profits.
For me, charts provide that great information and allow me to build confidence heading into a trade. This is unlike the feeling I get when trying to read through financial statements and make heads or tails of an earnings call.
Charts do not have all of the answers though. I have found it helpful to have additional resources to find potential set ups or add conviction to a trade I already have in mind.
That is what led me to my new favorite trading app, Prospero.ai. Which by the way is completely free and I have no stake in. I just really like the app.
Net Options Sentiment with Prospero.ai
A new favorite tool, and completely free, is the Prospero.ai app. I recommend checking it out. Again, it’s free so why not.
The added confidence you can get from this app in just minutes is amazing.
Using the CPNG trade as an example, after gathering all of the information I could from the charts I checked the Prospero app to view the options sentiment as well as other factors to see if anything interesting popped out.
Net Options Sentiment is a measure of how bullish or bearish the options markets appear to be in the very near term. The ratings are between 0-100 and anything above 80 indicates bullish sentiment (the stock is expecteed to go up) where a rating below 20 indicates the exact opposite, bearish sentiment.
While CPNG did not get above 80, it had a higher score that came in at 70 which gave me added confidence for a short duration trade. The score aligned with what the chart was telling me.
I also noticed the higher score for Net Institutional Flow which came in at 70 as well. I have noted previously and will continue to reiterate, when institutions are buying you can profit from the momentum if you identify the large buying early enough.
The higher score indicated institutions were buying CPNG, again bolstering my confidence heading into the trade.

A final note I made was the Short Pressure Rating was fairly low. Not something that really added to my belief in the trade, but nice to see it was not a high number.
In addition to using Prospero to add confidence to a trade, I like to use the app to find potential trade opportunities. They have categories like “Upside Breakout” that you can scan for new ideas.
I also enjoy the Newsletter Prospero publishes every week. You can find it on my recommended list, check it out!
All of this great information, both from the chart and from a simple and easy to use app like Prospero, is what allowed me to enter the CPNG trade with maximum confidence.
Add in having a clear strategy with entry and exit points planned ahead of time, and a well thought out trading thesis, plus the commitment to stick to it, and you have the right combination for successful and consistent trading.
Twitter Spaces - Chart Reviews, Trading Strategies
Friendly Reminder and big thank you to everyone that tunes in!
Every weekend I am hosting a Twitter Space with Shaun Clarke - @ShaunClarke_ and Kaye @InvestKaye reviewing dozens of charts and talking strategies for the upcoming week.
It is a great way to sharpen your chart analyzing skills while hearing about what we are each looking at for the upcoming week.
Link to this week’s Twitter Space: Sunday Trading Prep
I hope you find this information useful each and every week.
If you have any questions, be sure to find me on Twitter @tradernatehere and send me a DM! I am always up for talking trading.
Also, be sure to follow for daily posts as I pursue my goal of educating thousands on the many ways trading options can accelerate your path to early retirement and building generational wealth.
Have a great week of trading ahead!
-Nate