


Chips Reversing - Trading MRVL & MCHP
Semiconductors showing signs of a top after an incredible start to the year.
One day does not make a trend and honestly, neither does one week.
That said, last week was worth noting as new all-time highs were made again. But SPY, QQQ, and DIA all finished the week in the red.
Getting right to the charts, SPY closed the week selling on Friday with a long upper wick on the red candle.
Still above the 5-day Simple Moving Average (SMA) but there are signs that make me think we might finally see a bit of a pull back.
Take a look at the Average Trading Range (ATR) which is starting to rise and compare that to the selling in September and October of last year.

As volatility increases, the daily range SPY is trading in has widened which is reflected by the higher ATR.
The Relative Strength Index (RSI) has also hinged downward, which by itself is not a sell signal, but a continued drop in RSI coupled with rising ATR is a bearish combination.
There is a gap below which would completely fill if shares dropped to 497.37. This would be roughly 2.7% lower from Friday’s close and an area I am keeping an eye on.
The 50-day SMA is a little lower near 491 and is another level of potential support if we do see a reversal in the coming weeks.
Semiconductors have been leading the way and if you have been on this ride with us you have seen outstanding gains to start the year. Congrats!
I am bullish long term, but I do think it is time for a little rest.
The chart will tell us everything we need to know for this sector and I expect we get the signal Monday.
Take a look at the chart for semiconductor ETF SMH, which has NVDA as its largest holding. A massive bearish engulfing pattern has emerged.
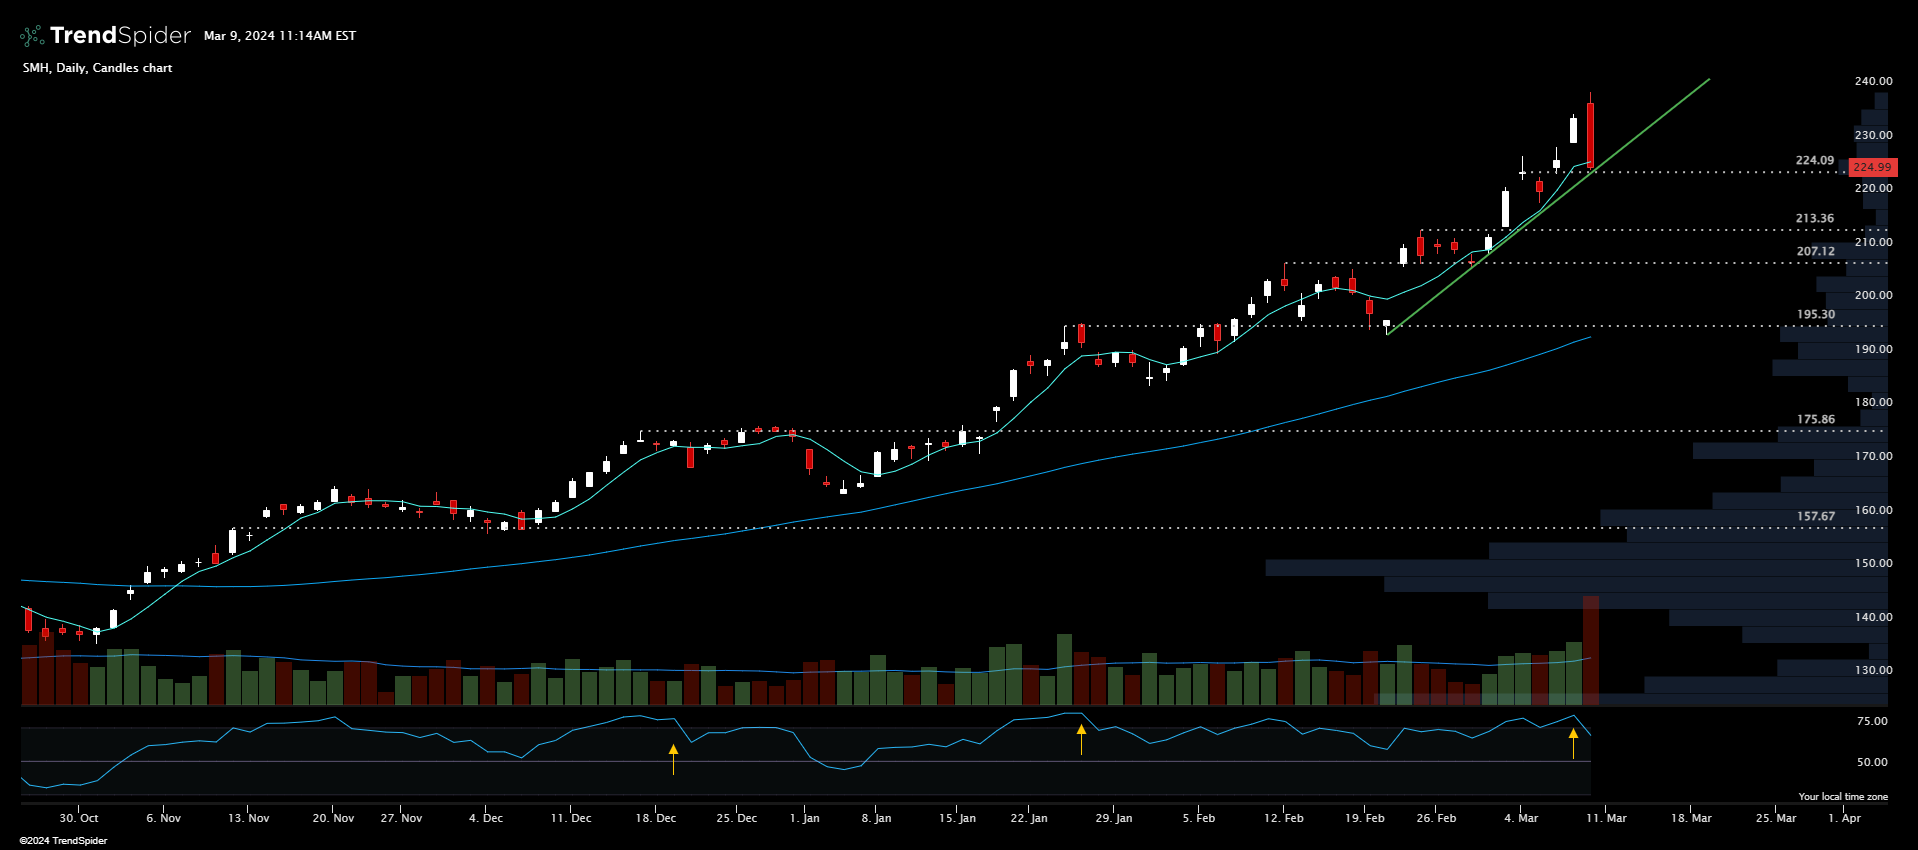
That large red candle that opened higher than the prior day’s high and closed lower than the prior day’s low is what is known as a bearish engulfing candle.
As you might have guessed, this is a bearish candle and it could signal a reversal is about to begin.
I like this set up for a trade because this bearish candle closed right at support, which is also just below the 5-day SMA, and just above the recent trendline.
This simplifies the trade. Either we get a nice bounce off of 224 or shares break down below, retest, and are rejected at this same level opening up a short trade.
I do not love the options for SMH. The implied volatility is just too high which elevates the price of the options to a point that makes trading them difficult.
I do like to find names in the sector that also look ready for similar action and that is what brought me to the charts of MRVL and MCHP.
MRVL has reversed hard after its recent run and I’m looking for a retest of resistance followed by more downside in the near term.
This also presents an opportunity for selling covered calls or cash secured puts.
MCHP also had a hard reversal forming a “tweezer top” pattern right at resistance. Often a sign for more selling to come and a favorite set up for going short.
I do prefer to trade the upside, but there is money to be made on the way down. If you take advantage, you can roll those gains into long term positions that have been beaten down.
We have an interesting week approaching so I think having more trade ideas to consider makes a lot of sense. I will have more on Monday morning for you as well.
To the trade ideas!
Keep reading with a 7-day free trial
Subscribe to A Trader's Education to keep reading this post and get 7 days of free access to the full post archives.