


Buying Opportunities for the Bold
Stocks dropped to start the year. Now a few are trying to bounce off of support.

Yesterday, I highlighted the rising wedge that had formed across multiple semiconductor names.
The charts included the VanEck Semiconductor ETF itself forming the pattern.
A rising wedge typically runs out of momentum, fails spectacularly after shares break the bottom of the pattern, and then sees shares continue the selling until support is found.
Little time was wasted at the start of the year before we saw multiple names breaking through the bottom of their respective wedge patterns, bringing key support levels firmly into play.
These are the opportunities we look for, the areas to buy at a discount, and it is never easy to actually do.
Tuesday was ugly and there is still room to drop. If the ten-year treasury yield continues to rise there is a good chance tech stocks slide a little more.
Add in the pressure from those taking profits after the solid gains in 2023 and you have enough reason to see more of a pull back to start the year.
But support levels could hold and if they do, that is the time to be bold and to buy.
SMH

The above chart shows the break of the rising wedge, which can largely be attributed to NVDA and AMD selling off.
Is $160 going to be retested? I kind of hope so.
NVDA

After starting the day off poorly, NVDA continued to sell and clearly broke the uptrend it had been enjoying.
I think the 50-day simple moving average (SMA) comes into play, which would bring shares down to about $465.
If shares respect the 50-day SMA and bounce, that would be a very bullish sign and I would consider adding to my long positions.
AMD

I think AMD might have another dollar or so to drop but that could be about it.
The wedge pattern was running out of room and AMD broke down in a big way to start the year.
Watch for a bounce at $137.50 which is an initial support level. Below that the 50-day SMA shows up near the $127 support level.
If you like these charts and you’re interested in using Anchored VWAP, scanners based on chart patterns, and the best charting software I’ve come across. Check out TrendSpider.
I mentioned that I like the set ups for AMAT, MRVL, ON, and RMBS. I like them even better now as support is quickly being tested.
For both AMAT and MRVL, we got the pull back to support that was outlined in yesterday’s newsletter. The only thing left is for support to hold and the trade for upside to be taken.
Let’s see it!
If you missed these trade ideas, be sure to subscribe and get access to both of them plus multiple trades to consider every week!
You get price levels for entering a trade, targets for taking profits, and details on which options contracts I am considering.
I literally try to make it as easy for you as possible to trade the same way I do.
And while I do love the semiconductor names, I see additional opportunities emerging in the energy space and will be highlighting those soon.
One or two more days of trading and the charts should be able to provide the infomation we need.
For now, check out XOM rejecting at the 50-day SMA.
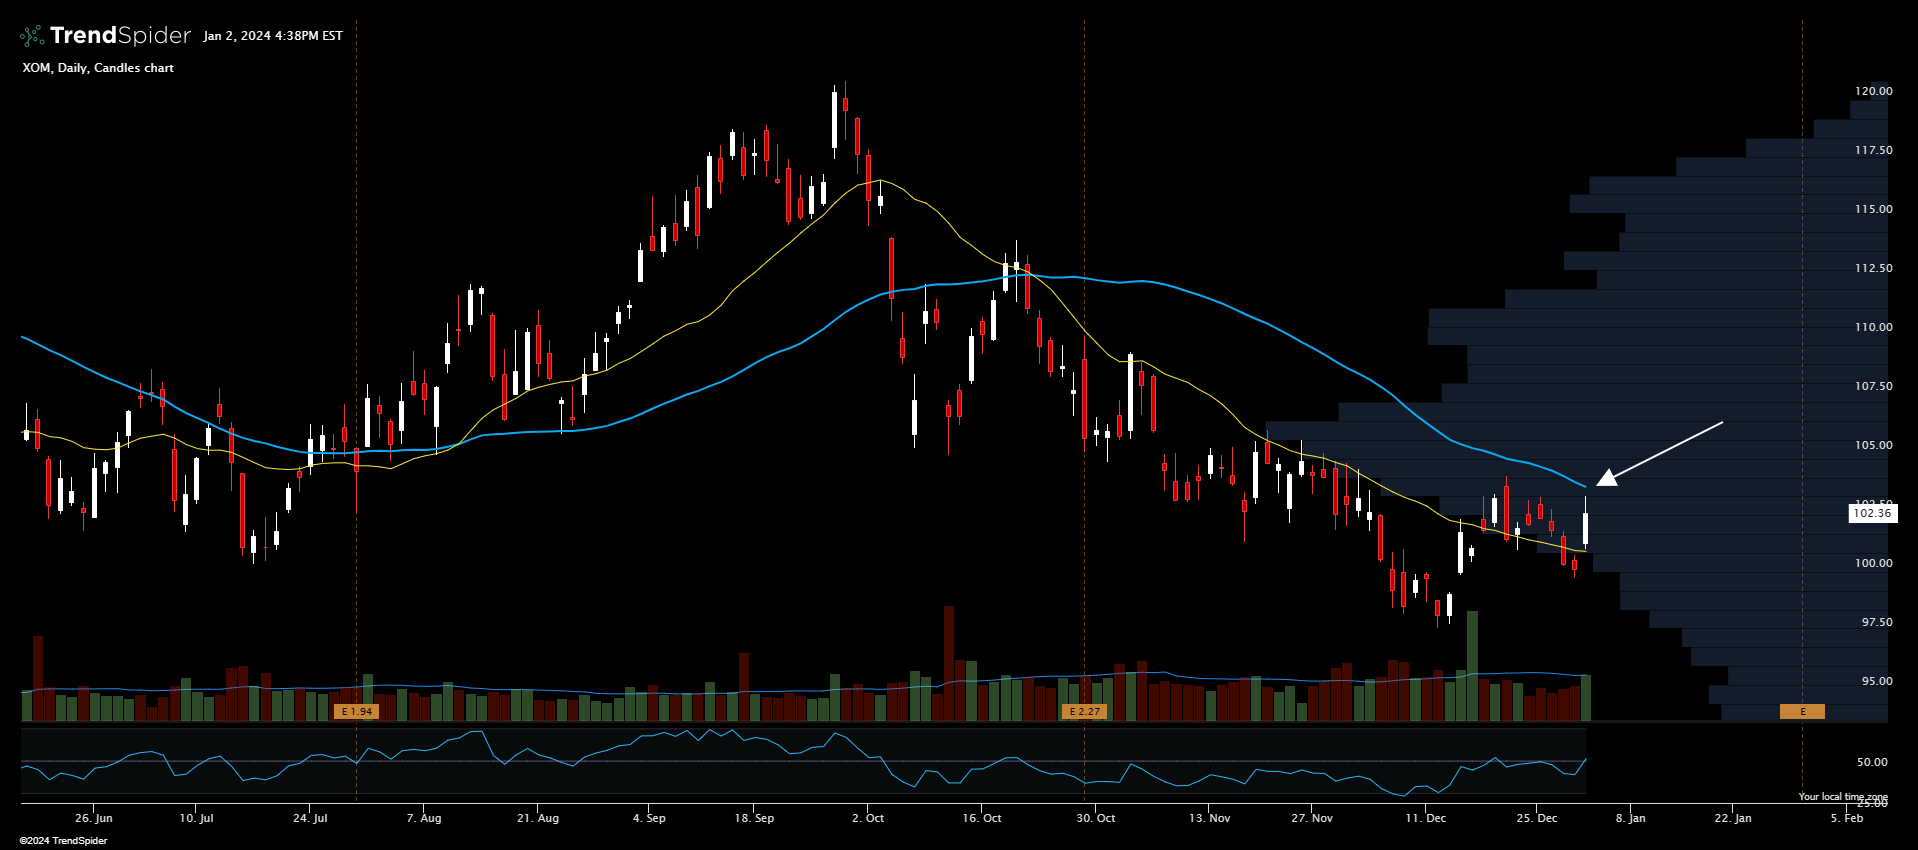
The energy sector has paid well and there are some clear levels being tested which creates interesting opportunities for trading. More on that soon.
Have a great day and I hope a profitable one too!
-Nate
This service is for general informational and educational purposes only and is not intended to constitute legal, tax, accounting or investment advice. These are my opinions and observations only. I am not a financial advisor.