


Bullish Signals for SPY & SMH
Diving into different time frames. Plus, the chart of the week.

If you are searching for signs of a near term reversal using the daily candles, you might want to consider looking at different time frames.
The two-hour candles give a little more detail into the latest price action and the thirty minute time frame drills in even further.
When I am considering swing trades, I typically go to the daily candles for levels of support and resistance. When I am looking for direction in the next week or maybe even just the next few days, I find smaller time frames to be very helpful.
Take a look at the two-hour candles for SPY.
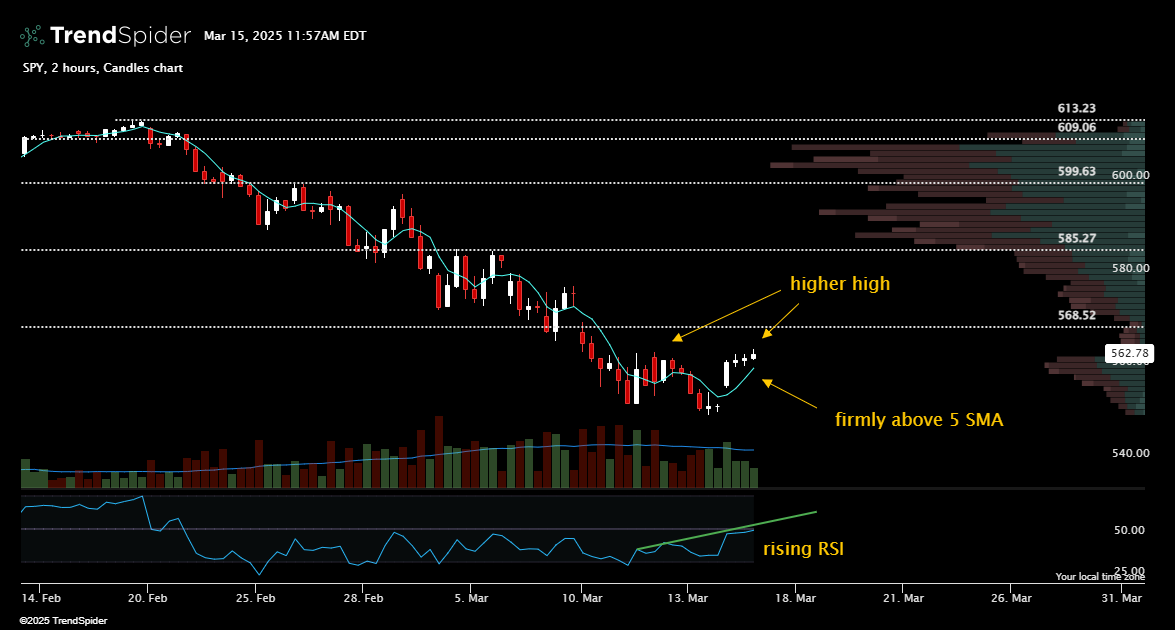
Three signals jump out at me. First, the higher high that formed to close out the week shows that buyers stepped in and were able to create some upside push.
That is how momentum starts to build.
Next, notice the four consecutive candles closing well above the 5 candle simple moving average (SMA). Looking back on the chart, every time there was a push above this SMA the candles would retreat immediately.
It is positive to see this trend. It is also early, but a positive sign and worth noting.
I will be looking for support from the 5 SMA which would show us strength and be a sign that momentum to higher prices is taking hold.
Last note for SPY, the increasing relative strenght index (RSI) for the 2-hour candles. There is plenty of room for it to continue rising.
Semiconductors might also be showing signs of life. Looking at the 2-hour candles again, SMH is interesting.

There is a lot to like about this chart.
First, higher highs and higher lows set in to close out the week. While powering higher the candles cleared both the 20 and 50 SMAs, turning the 20 into support.
Now the candles are holding above the 5 candle SMA, similar to what we saw above with SPY. Another bullish signal.
And RSI is continuing to climb higher in lockstep with the price action.
I would really like to see this sector catch fire again and am finding new trade ideas in names I know and love. Names like MRVL, NVDA, and INTC.
Chart of the Week
This is not going to be a regular segment, or maybe it will be if it is popular enough. But I had to call out the chart for PLTR this week so why not give it extra attention with its own section.
The daily candles for PLTR are why I added to my options position to close out the week. The ATE private chat was notified and now we are set up for big gains.
Here’s the chart that got me bullish.

My favorite pattern to call out, a higher low was put in for PLTR and it happened right on top of the anchored volume weighted average price (AVWAP) yellow line.
The support is real and the candles proceeded to rise above the 5-day SMA to test the 50-day SMA on Friday.
At the same time the 84.79 level was broken through cleanly, removing resistance and getting above the volume shelf that formed near and around 80.
RSI made a new high and is aiming higher heading into a full week of trading.
Did I mention the higher low? I really like seeing it.
Upgraded subscribers can expect updated notes on the PLTR trade, including additional call options to ponder.
Two new trade ideas are also coming in hot! This time we are considering options trades for SMCI and CPNG.
If you haven’t upgraded your subscription yet, now might be an ideal time as the selling slows down and upside momentum regains center stage.
I am excited for this week!
-Nate
And when you are ready for TrendSpider, please use this link to sign up! I am an affiliate because I use and benefit from the tools they provide.
Anchored VWAP is just one of the many top notch features I utilize.

This service is for general informational and educational purposes only and is not intended to constitute legal, tax, accounting or investment advice. These are my opinions and observations only. I am not a financial advisor.