


Big Time Trendline Trading for Profits
A look at trading using trendlines including a couple of ideas for this week.


This service is for general informational and educational purposes only and is not intended to constitute legal, tax, accounting or investment advice. These are my opinions and observations only. I am not a financial advisor.
The trend really is your friend and if you haven’t figured that out yet you are probably struggling with trading.
If you’re wondering what it means or how to trade the trend, this newsletter is going to answer a lot of your questions (let me know what I miss in the comments).
I’ve got even better news for you. Charts! This topic is best discussed using visuals which means a lot of charts for you this week.
Plus a few trade ideas of course. What are we doing if not talking about next week’s trades.
Last week I outlined a put spread for QQQ expiring June 23rd and by Wednesday profits were already available after a drop from $356 to $348.

And the drop on Wednesday this week that allowed for profit taking for those that got in can be seen in this chart of the hourly candles for QQQ.

Let me know if you got in on this trade! And if you have found the information provided in A Trader’s Education newsletter, feel free to pledge a couple of bucks in appreciation.
Thank you everyone for your continued support!
And if you are looking for more, I’ve got more! Soon you will be able to access all of my notes and trading plans.
Discord Room Opening in June
I have been dropping my trade plans and thoughts onto a Discord server over the past several weeks and am preparing to have it go live in June.
I post trade ideas across multiple tickers and note my thoughts heading into each trading week, complete with plans and charts.
Target levels, stop losses, and options trading strategies are outlined and updated throughout the week.
Let me know if you would be interested in access to the Discord Server and I will send you a discount code as a thank you for being subscribers to A Trader’s Education.
Here’s a look at the tickers I’m currently covering in addition to the weekly trading prep, trading education videos, and trading recaps. I hope you join!

Now to trading trendlines for more profits and bigger accounts. These are the goals and why I show up every week!
Trendline Trading - What Does it Look Like?
The beauty of trendlines is they can be used with any time interval.
Trendlines can be applied to 5-minute candles as well as hourly, daily, weekly, or even monthly. The trend really is your friend because it provides so much information.
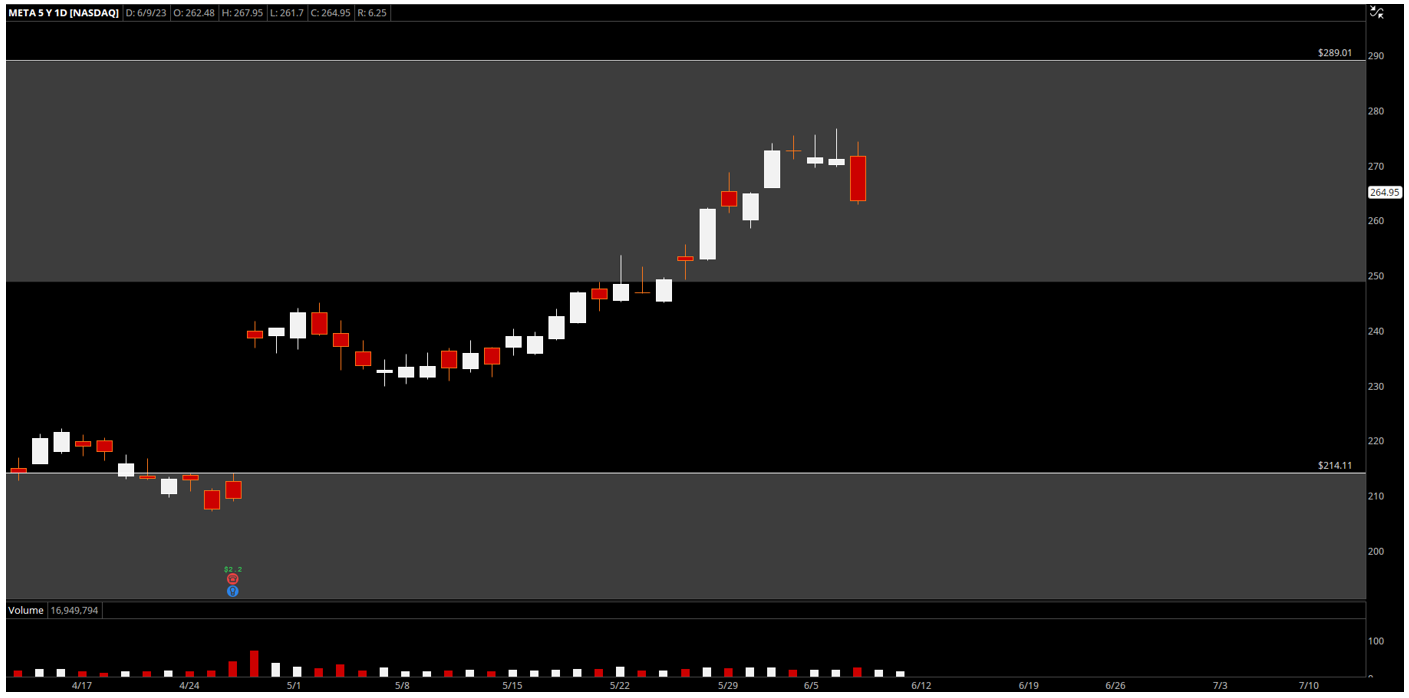
First example, the call option spread for META that was outlined last week. META has been on a clear uptrend, there is no reason to trade to the downside. Not yet.
But what if you didn’t draw the trendline and were only looking at the candles appearing to roll over after entering overhead supply.
The daily candles for META going back two months show this scenario playing out, tempting traders to take a short position.
But now consider zooming out to capture the entire year and drawing in a trendline.
Would you trade for downside on this chart? Or does it look like a good spot to prepare for going long for more upside?
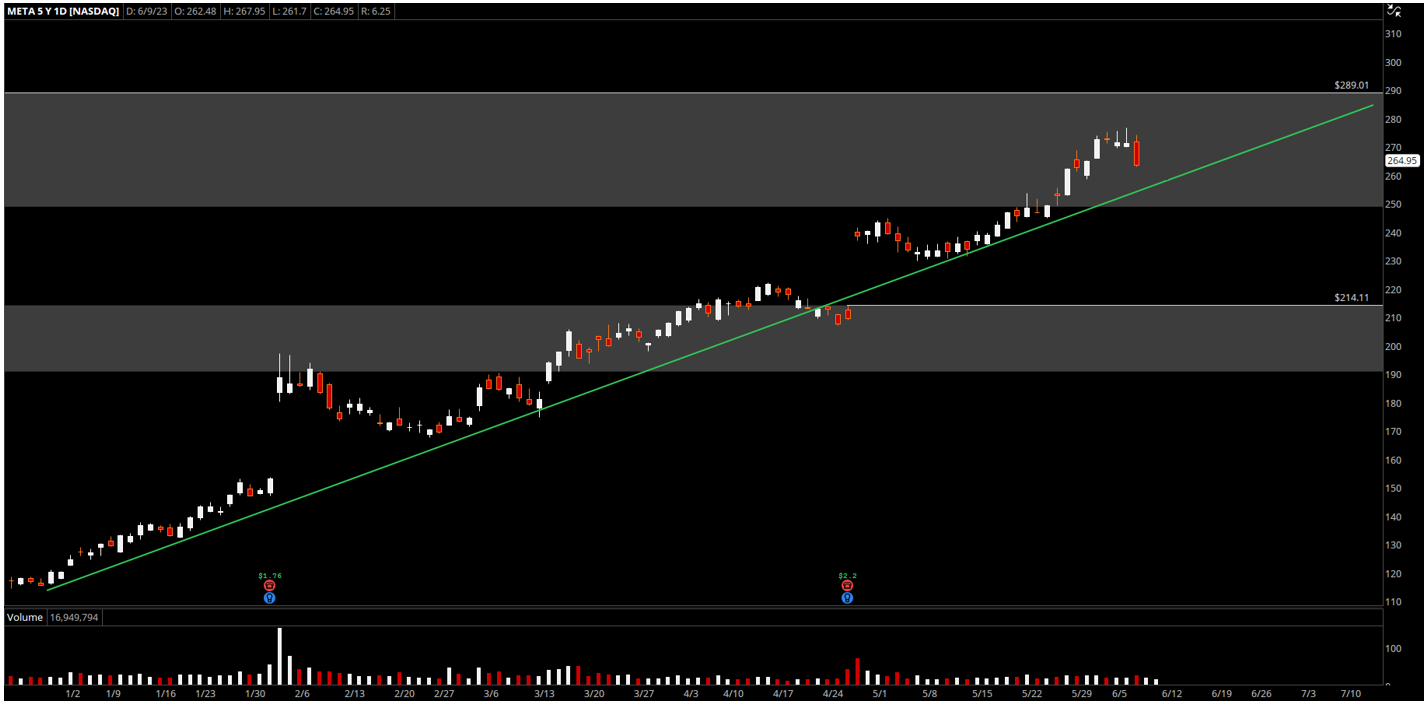
Anything can seem obvious in hindsight but a common trading mistake is to ignore the trend and instead trade a bias. A common and costly mistake which stresses the importance of knowing how to use trendlines.
For this example with META, the second chart highlights why the June 23rd call spread trade idea from last week’s newsletter is still a solid looking trade.
It might have been tempting to think, “META has run up enough and looks like it lost momentum” or “the candles flattened and are rolling over.” These are not trading plans on their own.
As a technical trader, you need to use multiple points of information provided by the charts in front of you. Without the information you are merely trading a bias or without a plan. Neither is advisable.
Example 2 - Day Trading with Trendlines
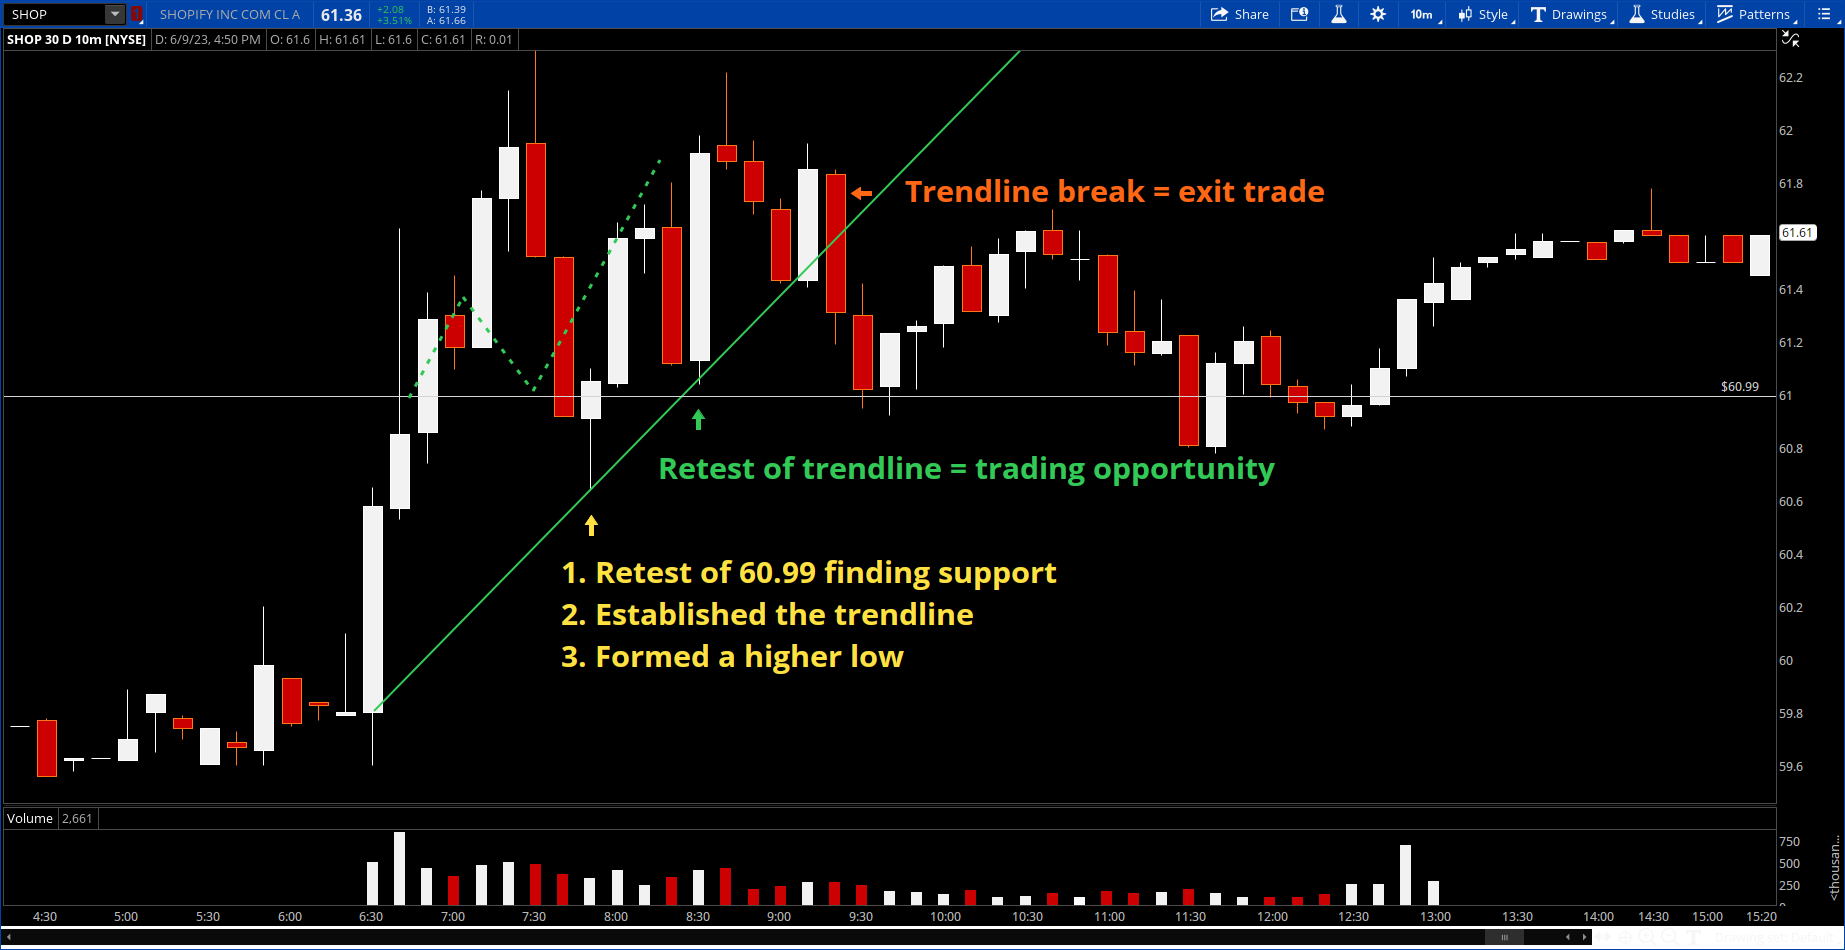
Let’s look at another example but this time zooming in to the 5-minute candles for day trading with SHOP.
I posted about needing to hold the trendline to continue the trade higher. At the time the chart was moving up nicely.


The initial entry for this day trade was when SHOP bounced near the 60.99 support level. This clean reversal was the first opportunity to trade to the upside.
The second opportunity was when SHOP tried to retest the support level but did not quite get there and turned upwards showing a higher low and strenght.
This also formed the trendline.
As long as the trend is respected moving forward, the trade remains on and after taking some profits it is a good idea to leave a few “runners” to capture more upside.
When do you call it quits? That is a great question!
First, if the shares reach profit targets be sure to stick to the plan and take profits at these levels. Even if it is your last trade and you’re exiting entirely, follow your plan.
Second, if the trend breaks the trade is over. It is that simple.
There will be occasions where the trend will be recovered but that is not what usually happens. In other words, it is hopeful at best to look for a busted trendline to recover.
The good news is that if the trend breaks and you exit the trade only to see it recover, you can always re-enter the trade. There is always another trade.
Unfortunately for the SHOP trade, that is exactly what happened. After taking profits and enjoying some quality upside the trend was broken and the trade was over.
Notice there was never another attempt anywhere near making new highs for the rest of the day.
Here’s another example of using trendlines with yet another timeframe. Taking a look at the 4-hour candles for IWM it is clear the trendline is being tested.
A nice move off of the lows then checked back to retest prior resistance, and formed the uptrend line. We are now right back to that trendline.

What happens next week? Will we see another bounce or a break of trend?
If you’re bullish, you can consider going long using at the money (ATM) calls or a call spread, buying the 185 strike and selling the 190 strike for the June 23rd expiration. If the trend breaks that is your signal to cut your losses.
If you’re bearish, wait for the trend to break with at least one strong candle closing below the trendline. For IWM, I like considering buying the $184 strike puts and if you want to offset the cost, selling the $180 strike, June 23rd expiration.
Moving Averages as Trendlines
Sometimes you don’t even need to draw the trendline, the moving averages will do it for you.
This is an even stronger signal for me. If the 50-day moving average has repeatedly been a resistance level as a stock declines, I am very likely to use this moving average as the trendline.
Here’s an example using VALE, which looks ready to reject again at the 50-day simple moving average (SMA).

We may not see a rejection with VALE but the probability is no doubt leaning towards more downside and that is the trade.
I like considering the $14 strike puts expiring June 16th or give yourself a second week with the 23rd expiration.
Finding consistent rejections against a moving average is a great shortcut to finding trendlines which is why I keep the 20-day, 50-day, and 150-day SMAs on the longer term charts.
For shorter durations, I use the exponential moving averages (EMAs) with the same effectiveness.
I hope this has been helpful and you are able to better utilize trendlines as part of your trading set up aresenal!
Trade wisely and with as much information as possible. And good luck this week!
Live on YouTube! Chart Review Sessions
If you are looking to sharpen your chart analysis skills further while hearing about what traders are looking at for possible trade ideas, be sure to also tune into A Trader’s Education podcast.
Streaming live on YouTube, I host The Trading Triangle to provide a more robust analysis complete with video. Be sure to subscribe and tune in every Sunday!
You will still also be able to find recordings of the stream on the A Trader’s Education podcast, which you can find on both iTunes and Spotify.
It is packed with value and always an all around great time!
Shaun Clarke - @ShaunClarke_ and Kaye @InvestKaye join me every week. You don’t want to miss it!
Thank you again for reading and have a great week!
Nate